|
|
 |
First principles assessment
|
|||||||||||||||||||||||||||||||||||||||||||||||||||||||||||||||||||||||||||||||||||||||||||||||||||||||||||||||||||||||||||||||||||||||||||||||||||||||||||||||||||||||||||||||||||||||||||||||||||||||||||||||||||||||||||||||||||||||||||||||||||||||||||||||||||||||||||||||||||||||||||||||||||||||||
| Responses and situations |
||
| Response |
Reduction in road traffic | Expected in situations |
|
|
|
Change of departure time is not an effect of this instrument |
|
|
Change of route is not an effect of this instrument, except where the public transport route is different from that of the car trip it replaced |
|
|
|
Use of public transport will cause the ‘best’ destinations to in which undertake particular activities to be re-appraised, making shorter journeys possible. |
|
|
|
Better public transport accessibility will encourage shift to walk or cycle (destinations are now closer)and cause the number of car trips to be reduced. |
|
|
|
Change of mode to public transport is expected to occur (the main objective of the instrument) and cause the number of car trips to be reduced. |
|
|
|
Better public transport will make the ownership of a car (or a second car) less important. Also, where the instrument makes a greater range of destinations available within a short distance, a car may become less necessary. |
|
|
|
Encouraging moving house is not a specific objective of this instrument, but some may want to move house to new, public transport orientated developments |
|
Short and long term demand responses
Though appropriate land use changes can potentially be a very effective
way of promoting a modal shift to public transport, land use instruments
are also the ones which take the longest to implement and thus to bear
fruit. The greatest opportunities for change are in the circumstances
of entirely new development, when land use densities and mixes may be
specified in advance. Even in these conditions however, results will take
years to materialise, as shown in the table. In the table, the time is
taken to be from when the land use change is started, so generally there
will be almost no response in the short term and very little in the medium
term, as can be seen.
|
Demand responses |
|||||
| Response | 1st year | 2-4 years | 5 years | 10+ years | |
|
|
No response | ||||
|
|
No response | ||||
|
|
Use facilities which are now closer |
|
|||
|
|
Use public transport (or walk or cycle where destinations are now closer) |
|
|||
|
|
To bus or rail, which are now more viable, so provide better service. |
|
|||
|
|
Less need for a car |
|
|||
|
|
No response | ||||
| = Weakest possible response, | = strongest possible positive response | ||
| = Weakest possible negative response, | = strongest possible negative response |
| = No response |
Level of response
The amount of mode shift to public transport in response to land use instruments will depend on:
One study of travel patterns in a North American suburb found the elasticity of transit (public transport) travel with respect to land use density to be +0.10 to +0.51, depending on type of land use. This means that each 1.0% increase in density increases public transport use by 0.1 to 0.51% (VTPI, 2002). This is illustrated in the tables below.
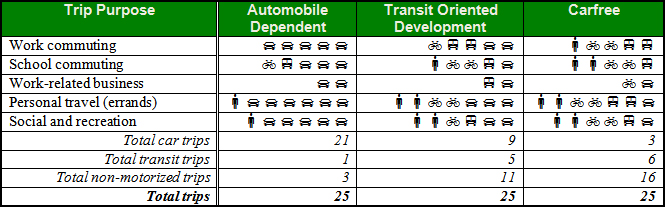
Typical Mode Share By Trip Purpose For Various Transport Systems (VTPI, 2013)
Travel Impact |
Rating |
Comments |
Reduces total traffic. |
3 |
Reduces per capita vehicle travel. |
Reduces peak period traffic. |
2 |
" |
Shifts peak to off-peak periods. |
0 |
|
Shifts automobile travel to alternative modes. |
3 |
Encourages transit and nonmotorized travel. |
Improves access, reduces the need for travel. |
3 |
Increases density and land use mix. |
Increased ridesharing. |
0 |
|
Increased public transit. |
3 |
|
Increased cycling. |
2 |
|
Increased walking. |
3 |
|
Increased Telework. |
0 |
|
Reduced freight traffic. |
0 |
|
TOD Travel Impact Rating from 3 (very beneficial) to –3 (very harmful). A 0 indicates no impact or mixed impacts (VTPI, 2013).
Supply impacts
The direct and indirect supply implications of this instrument are as follows:
Though the costs of new development are considerable and land use solutions are, at their most extreme, the most expensive of the policy instruments contained in these pages, the cost usually falls in the main on the private sector (through investors, developers and occupiers). However, local authorities may have to bear some additional indirect costs (provision of extra traffic control, parking, public transport interchanges, etc).
Though it is difficult to cost this instrument, the range of possibilities being so large, some comments on cost can nevertheless be made.
Firstly, regarding individual developments, it has been estimated (Lucas, Marsh and Jones (2000), p.19) that if development conforms to a standard to reflect sustainable development, construction costs will rise typically between 5 per cent and 20 per cent. Unfortunately the proportion of this extra cost related solely to the planning needed for better public transport is not known but it is likely that there would be some additional cost.
The main way of financing the extra costs of achieving a transport-friendly development policy, particularly where the extra cost would normally fall on the local authority, is through developer contributions.
VTPI (2002) refers to work by Kockelman (1997), Lewis and Williams (1999), Diaz (1999) and Weinberger (2001), who indicate that public transport friendly land use planning can often increase property values in an area. As a result, such projects can often be funded through "value capture" strategies, in which the costs of improvements are paid through the additional tax revenue or a special local tax assessment in the affected area.
If development costs are looked at region-wide, an alternative picture on costs, in which costs are actually lower overall, may occur. This is illustrated in the following table (costs in Canadian dollars) (VTPI, 2002)
Estimated 25 Year Public Costs for Three Development Options
(Blais, 1995)
| Form of development |
Spread |
Nodal |
Central |
|
Residents per Ha |
66 |
98 |
152 |
|
Capital Costs (billion Canadian $ 1995) |
54.8 |
45.1 |
39.1 |
|
Op & Maint Costs (billion C$ 1995) |
14.3 |
11.8 |
10.1 |
|
Total Costs |
69.1 |
56.9 |
49.2 |
|
Percent Savings over status quo option |
0 |
17% |
29% |
The table shows substantial public savings for higher density land use patterns associated with transport-friendly development.
Expected impacts on key policy objectives
Increasing land uses densities and modifying development mix encourage people to use public transport and walking and cycling more and so to travel less by car, through the mechanisms explained earlier. The resulting increase in use of these modes at the expense of car travel can have significant effects on various objectives as shown in the table below. Once again, these impacts are approximate, as the scale of the effects depends largely on the scale of land use changes.
| Objective |
Scale of contribution |
Comment |
|
|
|
By reducing motor traffic |
|
|
|
By higher standard development |
|
|
|
By reducing motor traffic |
|
|
|
Through increased accessibility |
|
|
|
By reducing motor traffic and creating less car-intensive neighbourhoods |
|
|
|
By developing more attractive locations |
|
|
- |
Uncertain effect |
| = Weakest possible positive contribution, | = strongest possible positive contribution | ||
| = Weakest possible negative contribution | = strongest possible negative contribution |
| = No contribution |
The expected impacts of land use planning to increase public transport
use are summarised in the following table.
| Contribution to the alleviation of key problems | ||
|
Problem |
Scale of contribution |
Comment |
|
Congestion |
|
By encouraging modal shift to public transport and so reducing motor traffic |
|
Community impacts |
|
By encouraging modal shift to public transport and so reducing motor traffic |
|
Environmental damage |
|
By encouraging modal shift to public transport and so reducing motor traffic and congestion in local centres. Includes reduction in "cold starts" from fewer car trips. |
| Poor accessibility |
|
By encouraging a situation for more viable public transport and by easier movement in newly-designed centres |
| Social and geographical disadvantage |
|
By encouraging a situation for more viable public transport, social and geographical groups are made more "accessibility equal" |
| Accidents |
|
By encouraging modal shift to public transport and so reducing motor traffic in local centres (pedestrian safety) in particular |
| Economic growth |
|
If land use planning increases accessibility, the area should become more attractive; the accompanying improved amenity will help enhance this effect |
| = Weakest possible positive contribution, | = strongest possible positive contribution | ||
| = Weakest possible negative contribution | = strongest possible negative contribution |
| = No contribution |
It is difficult to see how there can be any losers if policies of land use density and mix are wisely applied. This is because there should be a wider range of destinations within a given distance and public transport operations are made easier. There is no discouragement per se to any motorised mode: the reduction in traffic by encouraging public transport will in fact benefit all motorised modes.
|
Winners and losers |
||
|
Group |
Winners/losers |
Comment |
|
Large scale freight and commercial traffic |
|
Reduced congestion |
|
Small businesses |
|
Reduced congestion, better public transport access for employees and customers |
|
High income car users |
|
Reduced congestion |
|
Low income car users with poor access to public transport |
|
Public transport access will improve |
|
All existing public transport users |
|
Public transport access will improve |
|
People living adjacent to the area targeted |
|
Reduced congestion |
| Cyclists including children | Reduced car traffic, improved conditions for non-motorised users | |
| People at higher risk of health problems exacerbated by poor air quality | Improved air quality | |
| People making high value, important journeys | Bus access improved (and for car as congestion is reduced) | |
| The average car user | Reduced congestion | |
| = weakest possible benefit, | = strongest benefit | ||
| = weakest possible disbenefet, | = strongest possible disbenefit |
| = neither wins nor loses |
There are potentially severe barriers to implementation, particularly financial and related to feasibility. Legal barriers may also exist in cases where the current planning legislation would need amendment for this instrument to be implemented (e.g. if proposed development densities exceeded current standards).
|
Barriers to implementation |
||
|
Barrier |
Scale |
Comment |
|
Legal |
|
But only if legislation is not already in place |
|
Finance |
|
Unless developers can be persuaded to pay in some way for "sustainability upgrade" of their developments |
| Governance | Divided responsibility between the transport authority and the planning authority can make this instrument difficult to implement | |
|
Political acceptability |
|
Time needed to effect changes may make the instrument politically unattractive |
| Public and stakeholder acceptability | Public may oppose further densification. Developers may be unwilling to act. | |
|
Technical feasibility |
|
Not infeasible per se but amount of time needed may reduce feasibility. |
| = minimal barrier, | = most significant barrier |
![]()