


|

Evidence on performance
Case Study 1 : Variety of Measures That Have Lead to an Increase
in Cycling Levels in Europe and the UK
The results below demonstrate that cities which have a dense cycle network
(cycle facilities of up to one third of all roads), have achieved substantial
increases in cycling levels. It is notable that success has been achieved
in a variety of cities with a range of climates, land use densities and
topographies.
Positive impacts of cycling initiatives in Europe and the UK
| City |
Measures |
Outcome |
| Hanover |
450km cycle routes (on a total of 1,360km roads), 120
20mph zones, cycle parking service points in the city centre |
Share of cycling trips up from 9% (1979) to 16% (1990)
78% increase
|
| Munster |
£24m programme for upgrading old cycle routes,
340km of cycle routes (on a total of 600 to 700km roads), 3,300 parking
spaces at the station, hire fleet of 300 bikes, 7 Park+Ride sites |
Share of cycling trips up from 29% (1981) to 43% (1992)
48% increase
|
| Munich |
Cycle route network of 700km (out of a total of 2,300km
roads), further 200km planned within completion of 16 radial and 2
circular routes, 22,000 cycle parking spaces are available and an
increase at rail stations is planned |
Share of cycling trips up from 4% (1980) to 13% (2002).
225% increase
|
| Zurich |
Cycle route network of 246km (out of a total of 737km
roads), one-way streets opened to two-way cycling during the last
10 years |
Share of cycling trips up from 7% (1981) to 11% (2001)
57% increase
|
| Graz |
Cycle promotion programme. 220km of cycle routes (on
a total of 600 to 700km roads), cycle parking at public transport
links. 770km of streets in 20mph zones |
Share of cycling trips up from 7% (1979) to 17% (1999)
143% increase
|
| Vienna |
Cycle route network extended from 200km in 1991 to
900km in 2002 (out of a total of 2,730km roads). Most important measures:
completion of network, closing gaps, opening one-way streets and 20mph
zones. £13m spent between 1986 and 1999 |
Share of cycling trips up from 1.5% (1991) to 4.5%
(2001)
180% increase
|
| Leicester |
Cycle maps with information about 500 miles of recommended
routes, 60 miles cycleways, secure parking facilities combined with
information and repair centres |
54% increase in number of cyclists crossing city central
cordon between 1989 and 1995 |
| Hull |
Local cycling strategy, cycle network of 90km (£2m
programme), 90 areas with 20mph speed limit |
14% of all journeys to work are by bike |
| York |
Opening of Millennium Bridge with cycling facilities
in 2001 |
Number of cyclists crossing the river increased by
17% |
Source: TfL/CCE internet and literature survey 2003
Impact on Objectives
| Objective |
Comment |
| 
|
Significant increases in cycling levels reported
in all cases are likely to represent an improvement in transport
efficiency, especially in the longer term. However, there is insufficient
evidence to conclude with any certainty whether or not they justify
the cost. |
| 
|
No direct evidence is given on mode shift but it
is probable that some transfer from car has occurred. If this is
indeed the case then it will have contributed to an improvement
in liveability. Irrespective of transfer from car, the increased
levels of cycling are likely to slow car traffic and so improve
amenity. |
| 
|
No direct evidence presented, but the likely reductions
in car use will have contributed to a reduction in environmental
impacts. |
| 
|
No direct evidence presented, but the improved
acceptability and viability of cycling will benefit some of those
who are socially excluded. |
| 
|
No direct evidence presented, but evidence from
European countries and in particular Denmark and the Netherlands
suggest that increases in levels of cycling reduce both the absolute
number of accidents and the number of accidents per kilometre travelled. |
| 
|
No direct evidence presented, but evidence from
elsewhere suggests that the improved levels of fitness and health
associated with the increased level of cycling will lead to significant
productivity benefits and reduced health care costs. This may in
turn contribute to economic growth. |
| 
|
The cost of the infrastructure
is significant and reduced PT revenue due to transfer from PT is
a further issue. A further impact will be reduced tax revenue from
car use. |
Case Study 2 : Business Case and Evaluation of the Impacts of
Cycling in London (Draft) , Cycling Centre of Excellence, TfL, January
2004
TfL have carried out a business case and evaluation of the impacts of
cycling in London which aims to summarise the costs and benefits of three
scenarios of cycling investment over the next six years. The three scenarios
cover a range of proposed measures:
- Introduction of the new London Cycle Network Plus
(LCN+), which is projected to lead to 50,000 to 150,000 additional cycle
trips per day in London.
- Additional junction treatments, with those in place
already having improved cycle safety.
- Cycle parking schemes on street, at schools, homes,
workplaces and interchanges, which could lead to 40,000 to 340,000 additional
trips per day.
- Cycle training schemes which according to results
from schemes in place and survey results could increase cycling levels
by 5000 to 26,000 trips per day.
- Promotional activities such as cycle events, cycle
maps and provision of information. Survey results and the effects of
existing expenditure suggest that such measures are important in reinforcing
the benefits of infrastructure measures.
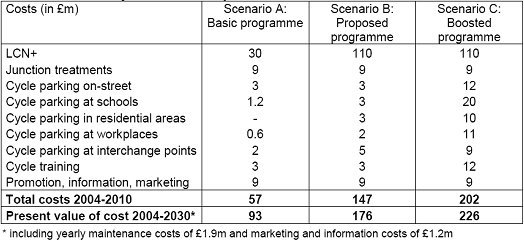
The three expenditure scenarios analysed range from an expenditure of
£57 million for scenario A, £147 million for scenario B and
£202 million for scenario C. The three levels of investment are
expected to lead to 90,000, 240,000 and 450,000 additional trips per day
respectively, which represents an increase in cycling of 30%, 80% or 150%
by 2010. The appraisal period is for 25 years with an annual discount
rate of 3.5%.
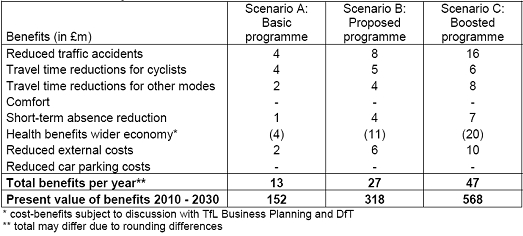
Summary of benefits for the three expenditure scenarios
- Increased road safety with an estimated reduction
in cycle casualties of 5% to 20% (20 to 90 killed or seriously injured
cyclists each year) according to the extent of the LCN+ junction treatments
and cycle training. Benefits of £4 million to £16 million
per annum.
- Travel time reductions of up to 30 seconds per kilometre
due to LCN+ and junction treatments are expected to give benefits of
£4 million to £6 million per year (all cycle trips given
the value of time of 11.9 4p per minute).
- Decongestion benefits for other road users due to
mode shift from buses to cycling (reduced operating cost) will lead
to benefits of £2 million to £8 million a year. Benefits
for mode shift from tube or car journeys are not included although the
analysis suggests a reduction in car trips of 23,000 - 110,000 with
a similar reduction for tube trips.
- Short-term absence from work is estimated to reduce
by 6% due to increased physical activity. Benefits between £1
million and £7 million a year are included.
- Wider health benefits such as the reduction in coronary
heart disease, stroke and colon cancer prevents between three and 16
early deaths a year, resulting in benefits of £4 million to £20
million per year (this element of the methodology is subject to further
discussions).
- Reduced external costs through reductions in the
air and noise pollution are taken into account. Mode shift from car
to cycling is assumed to give around 9 pence per kilometre, leading
to benefits of £2 million to £10 million per year.
- Reduced car parking costs for employers due to transfer
from commuting by car to cycling. Because of the lack of detailed data,
this is not included in the analysis.
- Comfort improvement benefits through safer conditions
and the better connected network are not included in
the analysis due to a lack of UK evidence.
Summary of projected costs and benefits for the three expenditure
scenarios, 2003 prices discounted at 3.5% per annum, 25 year appraisal
period
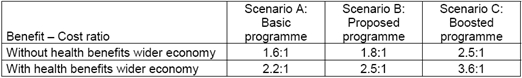
Benefit cost ratio of the three expenditure scenarios
Impact on Objectives (scenario B, proposed programme. All figures
given are the present value for total benefits over the appraisal period)
| Objective |
Comment |
|
|
Travel time savings for cyclists, and reduced crowding
benefits for bus users are included in the analysis and in combination
provide benefits of £106 million. Impacts on car drivers and
Tube travellers are not included. |
|
|
The reductions in car use and the traffic-calming
associated with the London cycle network will contribute to a liveability
improvement which is included under "reduced external costs"
and amounts to £70.6 million. |
|
|
The reductions in car use will contribute to a
reduction in environmental impacts which are also included under
"reduced external costs". |
|
|
The increased viability of cycling as an alternative
for increasing numbers of people will benefit the less wealthy and
socially excluded, these benefits do not form part of the analysis
presented. |
|
|
There are projected to be significant safety benefits
which amount to a reduction in accidents worth £94 million. |
|
|
Travel time savings for cyclists and bus users
amount to £106 million. Short-term absence reduction and health
benefits to the wider economy amount to a further £176.7 million.
These economic benefits alone amount to £282 million which
in themselves provide a benefit cost ratio of 1.61. Furthermore,
the proportion of the accident savings also represents the economic
impact of accidents so further strengthening the economic impact
of the proposed programme. |
|
|
Costs are significant
for a programme of this scale across the whole of London, although
significantly less than a city wide transport network for any other
mode except walking. For example, at £176 million for the
proposed programme, the cost is significantly less than that for
the construction of a single light rail line. |
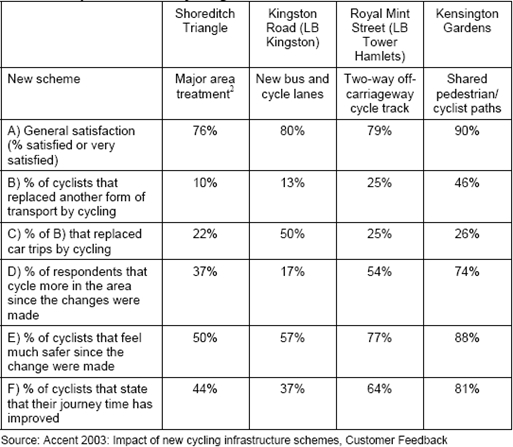
Case Study 3: Impacts of Specific New Cycling Schemes in London
(Business Case for Cycling in London (Draft), TfL, 2004)
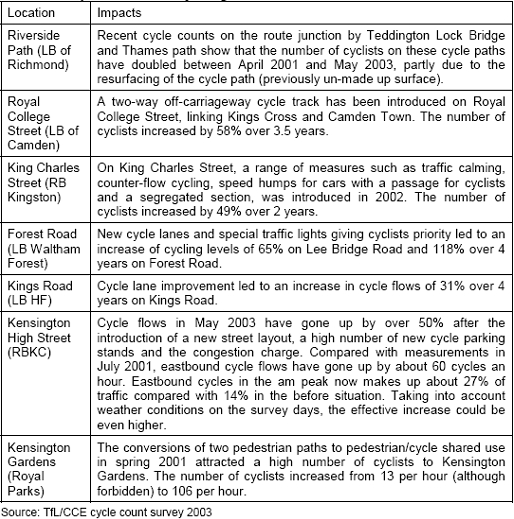
The table below gives examples of the impacts on levels of cycling of
individual new cycling schemes in London.
The impacts of individual new cycling schemes in London on cycle
flows
Survey responses of cyclists using individual new cycling schemes
at four sites in London
Impact on Objectives
| Objective |
Comment |
|
|
The results show that the individual schemes have
had a significant impact on cycling levels locally. The survey results
suggest that the majority of cyclists have had their journey time
improved and also that an average of 31% of those cycling previously
went by car. It is likely that these changes represent an increase
in transport efficiency. |
|
|
The measures themselves and the resulting increased
levels of cycling are likely to reduce traffic speeds and volumes
so improving liveability. |
|
|
The reductions in car use will have contributed
to a reduction in environmental impacts. |
|
|
The increased viability of cycling as an alternative
for increasing numbers of people will benefit the less wealthy and
socially excluded. |
|
|
Perceived levels of safety have increased significantly,
also increased levels of cycling invariably lead to reduced accident
rates per kilometre. |
|
|
Due to the transfer from private car there will
be decongestion benefits leading to increased productivity. There
are likely to be further economic benefits through improved health
which reduces absenteeism and health care costs. |
|
|
Costs are not given
but there is clearly a negative financial impact. |
Case Study 4: Cost Benefit Analysis of a Potential Danish Bicycle
Promotion Scheme (Cycling Will Improve Environment and Health, Ege &
Krag 2005)
The cost benefit analysis of a Danish bicycle promotion scheme was carried
out. The following assumptions were made:
- A 50% increase in the levels of cycling in Denmark associated with
a 30% increase in walking;
- the increase will be reached in 12 years through improved infrastructure
and marketing activities;
- 50% of the new cycle and pedestrian kilometres are assumed to come
from public transport with the other 50% from car driving;
- the appraisal period is 50 years (as prescribed in the official Danish
manual for cost benefit analysis in the transport sector);
- costs of infrastructure and marketing have been taken from experience
in Copenhagen and Odense; and
- the authors claim to have used conservative estimates for health benefits
based on experiences from abroad.
The benefit cost ratio is approximately 1.8 to 1. Because the vast majority
of costs are due to a loss of tax and public transport revenue the positive
cost-benefit ratio is capable of withstanding a significant reduction
in behavioural response or a major increase in infrastructure and campaign
costs.
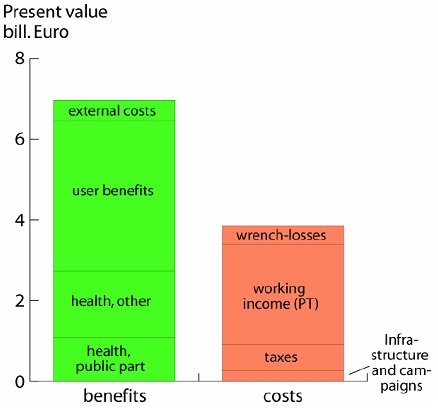
Note: "wrench losses" refer to the inefficiencies of the market
distortions associated with the required increase in taxation due to infrastructure
construction/campaigns, loss of PT revenue and reduced car tax.
Impact on Objectives
| Objective |
Comment |
|
|
User benefits due to transfer from private car
significantly outweigh the costs involved. |
|
|
The benefit component "external costs"
would be formed in part by liveability. External costs are not a
major component of the benefits but at approximately €0.5 billion
it is still significant and would reflect an improvement in liveability. |
|
|
External costs are shown to reduce by approximately
€0.5 billion which reflects a transfer from car and a benefit
to the environment in terms of local and global air pollution. |
|
|
The increased viability of cycling as an alternative
for increasing numbers of people will benefit the less wealthy and
socially excluded. |
|
|
Safety benefits do not appear to have been included
in the analysis. This may be because cycling in Denmark is already
possibly safer than in any other country. Increased cycling levels
are none the less likely to improve safety still further. |
|
|
Health benefits will improve productivity and reduce
health-care costs. Transfer from car by reducing congestion will
also improve productivity. These impacts may increase economic growth.
On the other hand a loss in PT revenues and taxes on car use may
necessitate an increase in taxation which may stifle growth. The
net effect is likely to be positive however. |
|
|
Impact on public transport
operator revenues and taxes is very significant. It is notable that
infrastructure and marketing represents only a small proportion
of the total costs associated with the project. |

|
