
First principles assessment
Why introduce cycle lanes and other cycle priority measures?
Introduction
This section is set out as follows:
- the varying levels of cycling in different countries are first illustrated;
- followed by evidence demonstrating that part of the explanation for
some countries having far lower levels of cycling than others is due
to lack of investment in cycle infrastructure generally, and specifically
in cycle lanes and priority measures; and
- finally, evidence is presented demonstrating that increasing levels
of cycling is a desirable outcome. The benefits of cycling in terms
of efficiency, environment and health are set out.
Differences in cycling levels between countries
The table below gives an overview of the modal split in some European
countries. Cycling tends to be more frequent in medium or smaller cities
than in larger cities.
Transport modes for individual daily trips in selected European
countries. Number of daily trips. Source: Solheim & Stangeby 1997
| Country |
Year* |
On foot |
Cycle |
Car as driver |
Car as passenger |
Public transport |
All trips |
Cycle mode share |
| Norway |
1991/92 |
0.66 |
0.20 |
1.70 |
0.39 |
0.26 |
3.25 |
6.1% |
| Sweden |
1994/95 |
0.48 |
0.37 |
1.25 |
0.50 |
0.33 |
2.93 |
12.6% |
| Finland |
1992 |
0.39 |
0.22 |
1.66 |
0.42 |
0.25 |
2.97 |
7.4% |
| Denmark |
1992 |
0.30 |
0.50 |
1.40 |
0.30 |
0.30 |
2.90 |
17.2% |
| Great Britain |
1992/94 |
0.84 |
0.05 |
1.07 |
0.63 |
0.25 |
2.88 |
1.7% |
| The Netherlands |
1994 |
0.67 |
1.01 |
1.28 |
0.51 |
0.19 |
3.74 |
27% |
| Germany |
1989 |
0.79 |
0.34 |
1.06 |
0.34 |
0.28 |
2.82 |
12% |
| Austria (Ober) |
1992 |
0.55 |
0.18 |
1.41 3 |
- |
0.37 |
2.59 |
7% |
| Switzerland |
1989 |
0.75 |
0.33 |
1.72 3 |
- |
0.46 |
3.50 |
9.4% |
| France-Grenoble |
1992 |
0.98 |
0.16 |
1.48 |
0.45 |
0.48 |
3.58 |
4.4% |
| France-Lyon |
1985 |
1.15 |
0.06 |
1.23 |
0.38 |
0.47 |
3.31 |
1.8% |
1 Trips longer than 200 m
2 Trips longer than 300 m
3 Trips as driver and passenger
The United States, unlike several European countries, does not have a
long cycling tradition. However, cycling levels have increased significantly
since the 1970s.
Annual US Bicycle Trips and Bicycle Mode Share, 1977- 1995 (NPTS,
DoT)
| |
1977 |
1983 |
1990 |
1995 |
| Bicycle trips (millions) |
1272 |
1792 |
1750 |
3141 |
| Adjusted bicycle trips (millions) |
1476 |
2078 |
2030 |
3141 |
| Bicycle mode share (%) |
0.6% |
0.8% |
0.7% |
0.9% |
| Car mode share (%) |
83.9% |
85.0% |
87.1% |
89.3% |
| Transit mode share (%) |
2.4% |
2.2% |
2.0% |
1.8% |
| Walking mode share (%) |
9.3% |
8.5% |
7.2% |
5.5% |
There are great differences between countries in cycle share of modal
split. The differences are due to different culture, history and cycling
policy, elements that constitute peoples' habits over years. The following
Danish quotations can illustrate this point:
"The bicycle is a national symbol for the Danes, as is the car for
the Americans."
"The Danes are almost born cyclists – just like the Norwegians
enter this world with skis on their feet." (Danish Road Directorate
& Ministry of Transport 1989)
In addition, urban density and structure as well as climatic and topographic
conditions in different countries will have an impact on the cycle share.
Will cycle lanes increase levels of cycling?
As noted above, there are a variety of explanations for the varying levels
of cycling between countries. However, the evidence below indicates that
investment in cycling infrastructure, and in particular the on-road network,
has a part to play in encouraging cycling levels.
In the EU project WALCYNG (How to enhance WALking and CycliNG instead
of shorter car trips, and to make these modes safer) people were asked
to give their opinion on barriers to cycling and important measures to
increase cycling. The figure "barriers to walking and cycling by
modal category" below shows that nearly 50% of “walcers”
(walkers and cyclists) mention lack of a sufficient on-road cycle network
as a barrier for cycling (Stangeby 1997), whilst the equivalent figure
for car drivers was over 50%. Among commuters in Norway 30% responded
that cycle lanes [and routes] were the most important measure to stimulate
cycling.
Barriers to cycling by modal category. Attitude surveys in Austria,
Finland, Italy and Spain. Per cent.( Walcer= walkers + cyclists) Source:
WALCYNG Stangeby 1997
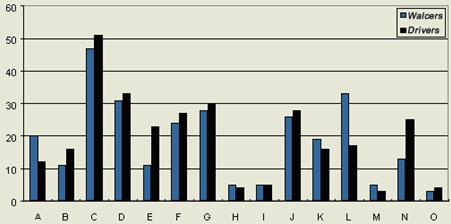
A=bad signing of cycle routes
B=bad upkeep of cycle paths
C=insufficient cycle road network
D=high speed of car traffic
E=non-ability of transporting heavy things
F=car noise and pollution
G=feeling of unsafety
H=pedestrians on the way
|
I=unattractive surroundings
J=Weather
K=fear of theft, lack of secure parking
L=ruthlessness of car drivers
M=badly constructed traffic lights, long waiting times
N=Laziness
O=Other
Copyright © TOI
|
Opinions on the most important improvements that can make people
start using a cycle. Per cent. The Norwegian Marketing/SP-survey among
commuters. Source: WALCYNG Stangeby 1997 (261 people surveyed)
| Improvement |
Percent |
| More cycling lanes |
30% |
| Less car traffic |
17% |
| Secure bicycle parking |
13% |
| Smoother road surface |
11% |
| Lower kerbs |
11% |
| Subways/crossings |
8% |
| Traffic lights at crossings |
4% |
| Better road signs and markings |
1% |
| Other improvements |
6% |
Why encourage cycling?
Cycling is an environmentally friendly (clean and silent), healthy, cheap
and flexible transport mode. In many European cities, cyclists lack space
and other facilities and cycling induces conflicts with vehicles and pedestrians.
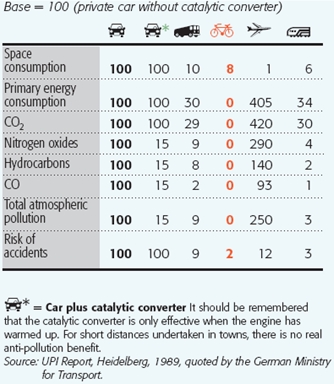
The table below provides a comparison of various transport modes from
an ecological viewpoint with a private car for an identical journey with
the same number of person kilometres. As can be seen, cycling compares
extremely well with all other modes on every category. The figure for
accident risk is far lower than that reflected in accident statistics.
This is because the figure excludes accidents that are caused by collision
with motorised modes. The figure therefore represents the intrinsic danger
involved in cycling in a traffic-free environment.
Comparison of ecological impact of various modes for a journey
involving a given number of person kilometres (European Commission 1999)
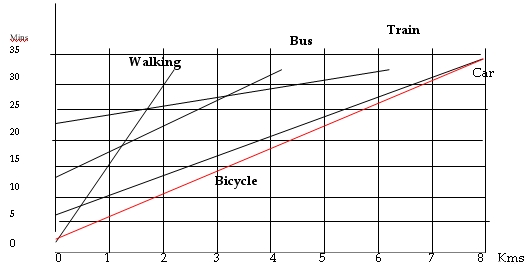
Cycling journey speeds
Cycling in urban areas is also efficient in terms of total journey speeds,
as is illustrated by the table below. Cycling tends to be quicker than
any other mode up to a journey length of 8 km. Clearly, the relative speeds
will vary according to location and time of day.
Comparative Table of Journey Speeds in the Urban Environment
(European commission, 1999)
Cycling is also a highly effective mode in combination with public transport.
Assuming a cycling speed of 20 km an hour and a walking speed of 5 km
an hour, cycling can increase the catchment area of a public transport
interchange by a factor of 15. This means that 60% of the UK population
live within 15 minutes cycle ride of a rail station (Gazey & Ades,
1998).
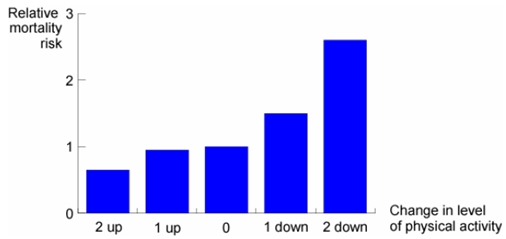
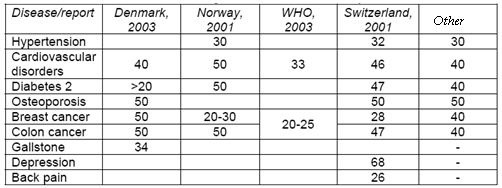
Health benefits of cycling
The figure below shows the impact that exercise levels have on mortality
risk. The table shows the results of evidence from various sources on
the impact of moderate exercise on the incidence of various diseases.
Effect on the relative mortality risk from changes in the level
of physical activity (Ege & Krag, 2005)
Potential disease reduction by moderate exercise, in percent
(Ege & Krag, 2005)
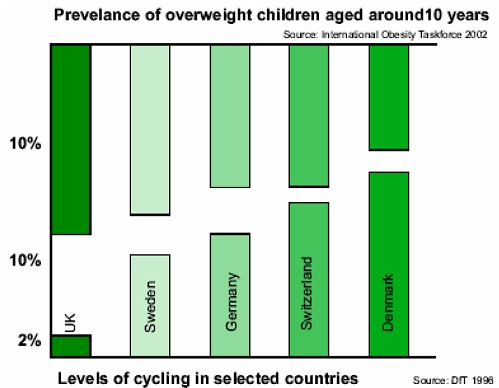
In many developed countries childhood obesity is becoming an ever more
serious health problem. The figure below shows the prevalence of overweight
children at 10 years old along with the levels of cycling in those countries.
For the selected North European countries there is a strong negative correlation
between these two criteria suggesting a correlation between cycling activity
and lower childhood obesity.
Prevalence of overweight children and cycling levels in selected
North European countries (Ege & Krag, 2005. Source DfT)
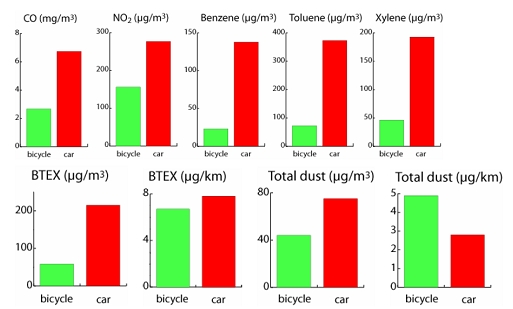
Comparison of exposure to pollution by car and by cycle
There are concerns that cycling in traffic will not be beneficial to
health because of the exposure to emissions. There is no doubt that if
possible it is healthier to cycle in traffic-free conditions. However,
if the choice is between cycling in traffic or driving then the evidence
seems to indicate that exposure is lower whilst cycling even after taking
into account the cyclists' increased breathing rate. The results of a
Dutch (top) and Danish (bottom) study are presented in the figure below.
The explanation for cyclists’ exposure being significantly lower
than that for car drivers is because cyclists tend to be situated on the
edge of the road and at a higher level where pollutant concentrations
are significantly lower than closer to the ground in the middle of the
carriageway which is where the air intake for most vehicles is positioned.
Exposure to pollutants by bicycle and in a car (Ege & Krag,
2005)
Increasing levels of cycling improves safety
Cycle lanes and priority measures can be expected to significantly reduce
accidents. The Institution of Highways and Transportation estimates that
remedial works at junctions can reduce casualty rates by 30% to 60% (IHT,
1997).
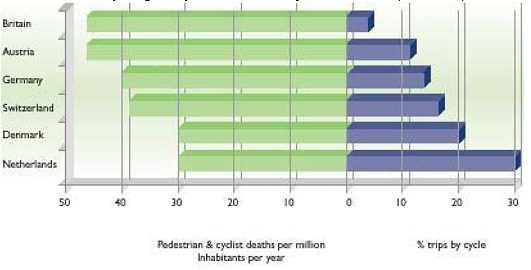
Furthermore, increasing levels of cycling tend to be associated with
lower pedestrian and cyclist deaths per inhabitant per year as is illustrated
in the figure below. This indicates that absolute numbers of deaths to
walkers and cyclists tend to drop as cycling levels increase. Measures
that encourage cycling tend to improve safety for both pedestrians and
cyclists. Furthermore, the presence of significant numbers of cyclists
tends to improve awareness and reduce speeds of car drivers.
Modal share of cycling and pedestrian and cycle casualties (TfL,
2004)
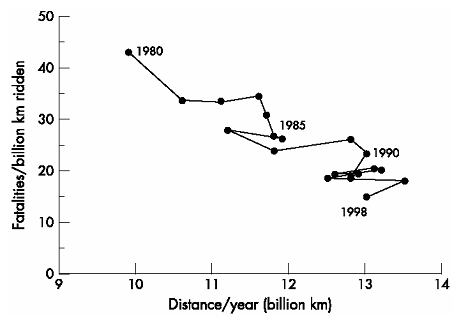
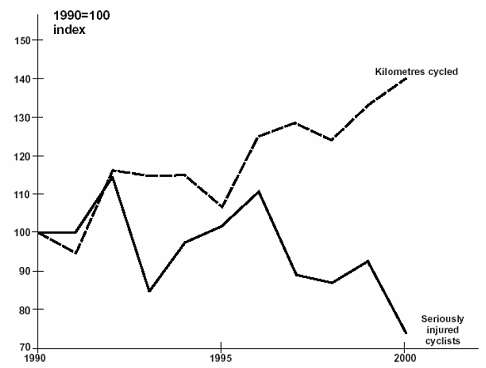
Further evidence to this effect is shown in the examples illustrated
below of Holland and Denmark where increases in the level of cycling have
been accompanied by significant reductions in both the absolute number
of accidents and accidents per kilometre cycle.
Increase in cycling levels and drop in the level of risk in the
Netherlands 1980-1998 (Ege & Krag 2005)
Increase in cycling levels and drop in absolute numbers of serious
injuries to cyclists in Denmark from 1990 to 2000 (Ege & Krag 2005)
In most countries cycling is significantly more dangerous than travelling
by car. However, when cycling reaches levels seen in the Netherlands and
Denmark the total accident risk is at least comparable. The table below
compares the risk of driving and cycling. The figures have been corrected
for two factors to create a more accurate comparison:
- A factor is applied to exclude motorway driving because motorway journeys
cannot be compared with cycle journeys; and
- A factor is applied to reflect the risk that car miles present to
other road users (the equivalent figure for cyclists is negligible).
A further issue that should be noted regarding the statistics presented
here is that killed and seriously injured statistics would be significantly
higher for cycling compared to driving than these overall accident statistics.
On the other hand, casualties per trip (arguably a more accurate comparison)
would appear far more favourable to cycling. Furthermore, if child casualties
were removed from the statistics (a category that does not exist for car
drivers) then the casualty rates for cyclists would be reduced.
Comparison of Risk of accidents per million kilometres for motorists
and cyclists in the Netherlands (European Commission, 1999)
| Age group |
Motorists (drivers) |
Cyclists |
| 12-14 |
- |
16.8 |
| 15-17 |
- |
18.2 |
| 18-24 |
33.5 |
7.7 |
| 25-29 |
17.0 |
8.2 |
| 30-39 |
9.7 |
7.0 |
| 40-49 |
9.7 |
9.2 |
| 50-59 |
5.9 |
17.2 |
| 60-64 |
10.4 |
32.1 |
| 64+ |
39.9 |
79.1 |
| All ages |
20.8 |
21.0 |
Whatever method of comparison is chosen it is clear that health benefits
significantly outweigh accident risks. Hillman has attempted to quantify
this by weighing up the life-years gained by cyclists in Britain due to
improved health, versus the life-years they lose through fatal injuries.
He concluded that the health benefits of cycling, even in the relatively
unsafe UK, outweigh the risks involved by a factor of around 20:1 (Hillman
1993). The British Medical Association drew similar general conclusions
and stated that the "benefits [of cycling] to health…are frequently
overlooked ... the British Medical Association highlights the significant
contribution cycling can make to the nation's health and calls for radical
changes in current transport policy"(BMA, 1992).
Demand Impacts
The responses to cycle lanes and priority measures are dependent on whether
or not they are implemented as comprehensive network solutions and in
combination with other measures (e.g. safe crossing points) that improve
safety such as lower speed limits.
| Response |
Reduction
in road traffic |
Expected in situations |
 |
 |
Cycle lanes and priorities are likely to increase journey speed
and reliability which is likely to allow a later departure. |
 |
|
Cyclists may change route in order to use a cycle lane and safe
junctions rather than ride on a route that has no provision for cyclists. |
 |
 |
Improved mobility by cycle might result in greater use of local
facilities and thus shorter shopping trips in the long run. |
 |
 |
Total trips may actually increase with the improved quality of cycling
provision. Possible reductions in capacity for cars may reduce car
trips. |
 |
|
Cycle lanes and priority may encourage mode switch from car and
public transport to cycle especially on shorter trips. |
 |
|
Comprehensive implementation of high-quality cycle lanes and priority
measures may influence car purchase decisions. |
 |
|
The quality of the journey to work and other key destinations may
be a consideration in relocation decisions. |
 | =
Weakest possible response, |  | =
strongest possible positive response |
 | = Weakest
possible negative response, |  | = strongest
possible negative response |
 | = No response
|
Short and long run demand responses
| Response |
- |
1st year |
2-4 years |
5 years |
10+ years |
|
- |
|
|
|
|
|
- |
|
|
|
|
|
Change job location |
|
|
|
|
| - |
Shop elsewhere |
|
|
|
|
|
Possible generation of cycling trips |
|
 |
|
 |
| - |
Possible suppression of some car trips due to reduced vehicle capacity |
|
|
|
|
|
From car to cycling |
|
|
|
|
| - |
From Public transport to cycling |
|
|
|
|
| - |
From walking to cycling |
|
|
|
|
|
- |
|
|
|
|
|
- |
|
|
|
|
| =
Weakest possible response, | | =
strongest possible positive response |
| = Weakest
possible negative response, | | = strongest
possible negative response |
| = No response
|
Supply impacts
Cycle priorities may reduce the capacity for other traffic slightly,
particularly at junctions.
If cycle lanes do succeed in encouraging mode shift from car then this
may well have a positive impact on the road space that is available for
other road users because cycles are significantly more efficient than
private cars in terms of space efficiency.
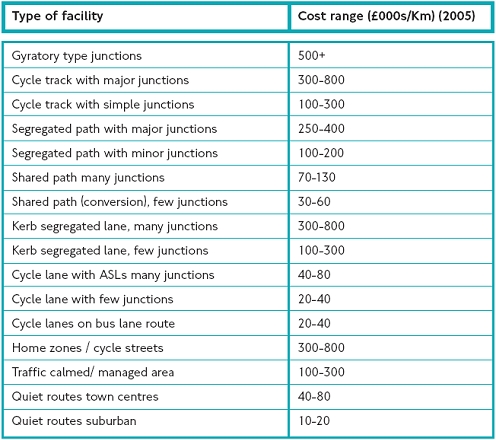
Financing requirements
The tables below are taken from London Cycling Design Standards. It should
be noted that construction costs in London tend to be higher than the
rest of the UK. Costs can be significantly reduced if a facility is implemented
as part of other works such as road resurfacing.
Global Costs of Various Types of Cycle Facility (London)
Expected impact on key policy objectives
In countries that currently have a very low level of cycling, the contribution
to objectives that cycling is likely to make in the short-term is significantly
less than in countries with more cycling. This is because take-up of cycling
is a gradual process which tends to be particularly slow at lower levels
of cycling.
Objective |
Scale of contribution |
Comment |

|
|
Cycling is space efficient,
relatively fast and uses few natural resources and is as such highly
efficient - especially over shorter to medium length journeys. |

|

|
Increased levels of cycling
and cycle priority measures tend to reduce the speed and possibly
the quantity of traffic. Cycle lanes and advanced stop lines also
increase the distance between pedestrians and motorised traffic.
Safer roads for cycling will also discourage cycling on the pavement,
a further benefit for pedestrians. |

|
|
If reducing car use, cycle
routes will reduce air and noise pollution. |

|
 |
Some groups of people
with lower incomes may benefit due to improved amenity and safety
of walking and cycling. |

|
|
Cycle lanes and priorities
will improve safety for cyclists particularly as cycling levels
increase because accident rates per kilometre cycled invariably
fall as cycling levels increase. |

|
|
The existence of cycling
as a viable alternative may significantly reduce journey times to
work so possibly increasing productivity and any decongestion impacts
may improve productivity still further. These benefits may also
encourage workers to locate in a particular area. Furthermore, reduced
absenteeism and lower health care costs resulting from cycling provide
an economic boost. |

|
|
Public funding is needed
because there is no obvious mechanism by which cyclists can pay
directly for use of lanes. Costs are relatively low compared to
most other types of infrastructure.
Transfer from car will reduce tax revenues from taxation on car
use.
The impact of transfer from public transport will depend on whether
the public transport system is running at or close to capacity.
If the subsidised public transport system is crowded then transfer
to bicycle may well reduce the need for public transport investment
and so provide a financial benefit. If the system is underused and
reduced patronage may represent a financial disbenefit.
|
| = Weakest
possible positive contribution, | | = strongest
possible positive contribution |
| = Weakest
possible negative contribution | | = strongest
possible negative contribution |
| =
No contribution |
Expected impact on problems
| Contribution to alleviation of key problems |
Problem |
Scale of contribution
|
Comment |
Congestion-related delay |
|
In the short-term some
measures may reduce capacity and so possibly increase congestion
but as take-up of cycling increases it is likely to contribute to
a reduction in congestion. |
Congestion-related unreliability |
|
In the short-term some
measures may reduce capacity and so possibly increase congestion
but as take-up of cycling increases it is likely to contribute to
a reduction in congestion. |
Community severance |
|
In the short-term some
measures may reduce capacity and so possibly increase congestion
but as take-up of cycling increases it is likely to contribute to
a reduction in congestion. |
Visual intrusion |
|
By reducing traffic volumes. |
Lack of amenity |
|
By reducing traffic volumes
and possibly speeds, and increasing distance between pedestrians
and motorised traffic. |
Global warming |
|
By reducing traffic-related
CO2 emissions. |
Local air pollution |
|
By reducing emissions
of NOx, particulates and other local pollutants. |
Noise |
|
By reducing traffic volumes
and possibly speeds. |
Reduction of green space |
|
If there is transfer from
car there will be reduced pressure for low density city expansion,
new road building and car parks. |
Damage to environmentally sensitive
sites |
|
By reducing traffic volumes.
|
Poor accessibility for those without
a car and those with mobility impairments |
|
Better accessibility for
those people without a car that may be able to cycle. Some mobility-impaired
individuals may have difficulty walking significant distances but
are better able to cycle. |
Disproportionate disadvantaging of
particular social or geographic groups |
|
Cycling offers increased
accessibility to those without a car available. |
Number, severity and risk of accidents
|
|
By reducing traffic volumes
and reducing conflict between cyclists and motorised vehicles. |
Suppression of the potential for economic
activity in the area |
|
The existence of cycling
as a viable alternative may significantly reduce journey to work
times, so possibly increasing productivity. Any decongestion impacts
may improve productivity still further. These benefits may also
encourage workers to locate in a particular area. Furthermore, reduced
absenteeism and lower health care costs resulting from cycling. |
| = Weakest
possible positive contribution, | | = strongest
possible positive contribution |
| = Weakest
possible negative contribution | | = strongest
possible negative contribution |
| =
No contribution |
Expected winners and losers
Group |
Winners / losers |
Comment |
Large scale freight and commercial
traffic |
|
Some measures may reduce
vehicle capacity which may increase congestion in the short-term
but the longer term effect is likely to be reduced congestion. |
Small businesses |
|
Small, local businesses
can benefit from trade from passing cyclists and improved local
access. Cycle lanes may require car parking spaces to be taken out
or be relocated. |
High income car-users |
|
No significant impacts
known. |
People with a low income |
|
Cycling is low cost transport.
|
People with poor access to public
transport |
|
Cycle provisions that
connect to main public transport hubs by increases catchment area.
|
All existing public transport users
|
|
In continental cities
high public transport use normally correlates with high cycle use.
|
People living adjacent to the area
targeted |
|
Improvements/reduction
of car traffic and public realm improvements which often are implemented
along with the introduction of cycle lanes will benefit people living
locally. Cycle lanes may require car parking spaces to be reduced
or charges introduced to make supply meet demand locally. |
People making high value, important
journeys |
|
Cycling is generally the
fastest and most reliable mode for peak hour trips between 1-3km
in congested urban areas, e.g. if catching a long-distance train
for a graduate job interview. |
The average car user |
|
Slight positive and negative
local impacts for car users possible. |
Barriers to implementation
Barrier |
Scale |
Comment |
Legal |
|
One legal barrier in the
UK and possibly elsewhere which discourages local authorities from
providing facilities is the fear that they will be subject to legal
claims for compensation for any accidents. |
Finance |
|
Cyclists do not pay directly
for use of facilities and so all funding must come from general
taxation. Costs are relatively low compared to most other types
of transport infrastructure. |
Political |
|
If cycling levels are
low then authorities are likely to be criticised for spending money
on unused facilities - a cultural change, whereby cycling increases
significantly, tends to take lengths of time which are often beyond
the planning horizon of politicians focused on the next election. |
|
Feasibility |
|
Cycling facilities are
unlikely to be technically unfeasible. |

|

