


|

First principles assessment
Why introduce physical restrictions?
Demand impacts
Short and long run demand responses
Supply impacts
Financing requirements
Expected impact on key policy objectives
Expected impact on problems
Expected winners and losers
Barriers to implementation
Why introduce physical restrictions?
Physical restrictions on car use aim to reduce the volume of vehicles to
achieve a more efficient use of road space in urban areas by reductions
of road capacity or reallocations of road capacity from car to other traffic.
These measures can also aim to improve the attractiveness of public transport,
provide better facilities for cyclists and pedestrians, and improve the
environmental quality and safety. SACTRA (1994) concluded that increases
in road capacity by new road construction
in congested conditions were likely to induce extra traffic to an extent.
In addition, it is generally difficult to provide sufficient new road capacity
in most urban areas, so attention is focused on the role and the use of
existing road capacity. Therefore it is expected that reductions in road
capacity for car use will lead to some reductions or suppression in car
traffic volume.
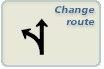
Demand impacts
The demand impacts of physical restrictions will depend on the types of
implemented measures. Most changes decrease in demand for car travel and
conversely increase in public transport, walking and cycling when road
capacity for car use is reallocated by introduction of other transport
priorities measures. This will contribute to transport policy objectives
seeking to reduce congestion and associated negative impacts. However,
impacts vary according to the capacity of a network at the site where
a physical restriction is implemented. The nature of the network and the
existing level of congestion affect the ability of traffic to change route,
vary journey time and make other responses. In some cases, when capacity
is reduced on one road, but there is still available capacity on other
routes or other times of the day, diverted trips such as re-routing and
re-timing occur, and congestion spreads out over time and space rather
than becoming worse on the treated road itself.
| Responses and situations |
| Response |
Reduction in road traffic
|
Expected in situations |
| 
|

|
Where the congestion increases in peak hours
on the road where capacity is reduced for car use. |
| 
|

|
Where the drivers need to divert from the route
where capacity is reduced for car use. |
| 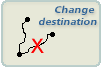
|

|
Though alternative destinations are not an objective
of reduced road capacity, or other destination is potential for
changing work location. |
| 
|

|
Where there is potential to work, shop etc from
home. |
| 
|
|
Where public transport provides an attractive
service, and cycle lanes or wider footpaths are available. |
| 
|
|
Where modal shift and/or reduction in number
of journeys makes owning a car uneconomic. |
| 
|
|
In the long term committed individuals may move
closer to frequent destinations or streets where it is possible
to walk, cycle or use public transport. |
 |
=
Weakest possible response, |
 |
=
strongest possible positive response |
 |
= Weakest
possible negative response, |
 |
= strongest
possible negative response |
 |
= No response
|
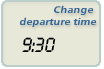
Short and long run demand responses
Demand response is different in the short, medium and long term. In the
first few days, there is a volatile and uncertain range of experience.
It differs according to advance publicity and information, and there is
a leaning period based on experience. During the first few years, after
the first adjustments, there tends to be a more settled period as traffic
adjusts to new conditions. In the longer run, case studies have revealed
two different patterns. One pattern is a tendency for an initial traffic
reduction to be offset by subsequent re-growth. In other cases where the
longer run effect is not an erosion of the traffic reduction but a build-up.
For example, the longer run reductions in traffic are greater than those
which occur at first (Cairns et al, 1998). The demand response
will vary depending on which types of measures are implemented through
the plan and whether more are phased in over time. Demand responses are
completed on the basis of an overall decrease in car use.
| Demand responses |
| Responses |
|
1st year |
24 years |
5 years |
10+ years |
|
|
- |

|

|
|
|
|
|
- |
|
|
|
|
|
|
Change job location |

|
|
|
|
| |
Shop elsewhere |
|
|
|
|
|
|
Compress working week |
|
|
|
|
| |
Trip chain |
|
|
|
|
| |
Work from home |
|
|
|
|
| |
Shop from home |
|
|
|
|
|
|
Ride share |
|
|
|
|
| |
Public transport |
* |
* |
** |
** |
| |
Walk/cycle |
* |
* |
* |
* |
|
|
- |
|
|
|
|
|
|
- |
|
|
|
|
|
=
Weakest possible response, |
|
=
strongest possible positive response |
|
= Weakest
possible negative response, |
|
= strongest
possible negative response |
|
= No response
|
*Where public transport or cycle priority measures are operated to reallocate
road capacity.
**With regard to modal shift to public transport, this is unlikely to
increase in the medium and long term if traffic congestion becomes unchanged
or worse than before.

Supply impacts
There are some decreases in the supply of road space for car use,
where road closures or changes to pedestrian area are implemented to reduce
road capacity, and bus priorities or cycle lanes are implemented to reallocate
road capacity. Conversely, other transport facilities increase in supply
like bus lanes, pedestrian areas and so on. However, total transport spaces
in some regions usually do not change in supply.
Financing requirements
The cost of physical restrictions depends on individual measures, but
is usually cheaper than measures to increase road capacity. Reallocation
of road capacity measures requires investment in operation of UTC
systems. If access control is needed in reducing road capacity
such as the closure of streets, investment and operating cost for the
enforcement of access control technology may be needed. Reconstruction
cost for pedestrian areas is sometimes needed to be paid.
Expected impact on key policy objectives
Physical restrictions are implemented to reduce car use and to promote
using other transport. They encourage people to reduce their overall level
of car traffic use in the city centre by switching from car to other modes.
Also, they will contribute to a liveable, attractive and safe city centre.
To see more detail on the impacts of individual measures, e.g. bus
priorities, cycle lanes,
traffic calming.
However, if capacity is reduced on a few roads or areas but there
is still capacity available on other routes, drivers may divert onto an
alternative route which still has available capacity. This will reduce
traffic congestion on a specific road, but not lead to an overall reduction
in the level of car traffic in an urban area.
Expected impact on problems
Physical restrictions would reduce car use in urban areas, hence they
have the potential to contribute to the alleviation of a number of key
problems.
| Contribution to alleviation of key problems
|
| Problem |
Scale of contribution |
Comment |
| Congestion-related delay |
|
By reducing car traffic volumes and providing reliable
public transport services; however there will be an increase in diverted
traffic |
| Congestion-related unreliability |
|
By reducing car traffic volumes and providing reliable
public transport services; however there will be an increase in diverted
traffic |
| Community severance |
|
By reducing traffic volumes and improving an attractive
pedestrian area; however there will be an increase in diverted traffic |
| Visual intrusion |
|
By reducing traffic volumes; however there will be
an increase in diverted traffic |
| Lack of amenity |
|
Where increased walking and cycling results from
the reduction of roads in a city centre there may be enhancement in
the viability of local facilities |
| Global warming |
|
By reducing traffic-related CO2 emissions |
| Local air pollution |
|
By reducing emissions of NOx, particulates and other
local pollutants; however there will be an increase in diverted traffic |
| Noise |
|
By reducing traffic volumes; however there will be
an increase in diverted traffic |
| Reduction of green space |
|
By reducing pressure for new road building and city
expansion |
| Damage to environmentally sensitive sites |
|
By reducing traffic volumes |
| Poor accessibility for those without a car and those
with mobility impairments |
|
By enhancing the reliability of public transport
and by discouraging car-oriented development in a city centre |
| Disproportionate disadvantaging of particular social
or geographic groups |
|
By enhancing the reliability of public transport
and reducing traffic levels |
| Number, severity and risk of accidents |
|
By reducing traffic volumes and/or improving a pedestrian
area; however there will be an increase in diverted traffic |
| Suppression of the potential for economic activity
in the area |
|
By improving the efficiency of the local road network
through reduced congestion |
|
= Weakest
possible positive contribution, |
|
= strongest
possible positive contribution |
|
= Weakest
possible negative contribution |
|
= strongest
possible negative contribution |
|
=
No contribution |
Expected winners and losers
One would not expect everybody to benefit equally from any transport measure.
Indeed, those who use priority transport modes should benefit from reduced
congestion. However, unless effective measures of parking control and/or
public transport are introduced there can be some losers through increased
traffic congestion.
|
=
weakest possible benefit, |
|
=
strongest benefit |
|
= weakest
possible disbenefet, |
|
= strongest
possible disbenefit |
|
= neither
wins nor loses |
Barriers to implementation
|
=
minimal barrier, |
|
=
most significant barrier |
|


