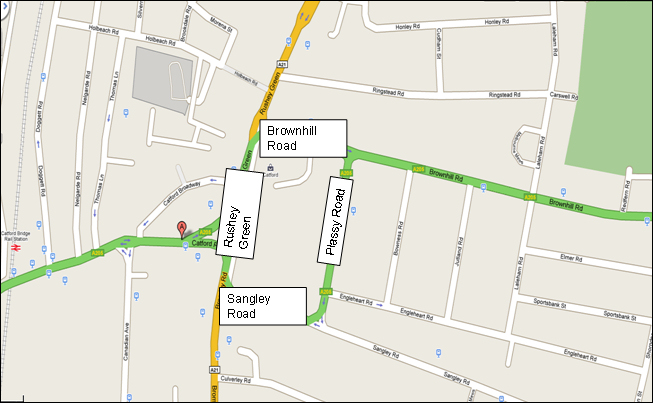
LinksGlossaryMessagesSitemapHelp


Home

Policy Instruments

Select
Search
Filter

Conventional traffic management


SummaryTaxonomy and descriptionFirst principles assesmentEvidence on performancePolicy contributionComplementary instrumentsReferences

Evidence on performance

Catford Traffic Management Study

The source of this case study is Pearce and Stannard (1973).

Context

Catford is a district of London, the town centre of the borough of Lewisham. The layout of Present Day Catford is shown in Figure 1. The roads that are labelled on Figure 1 were previously two way streets up to 1970 when they were converted into a one way system. The case study analyses the impact of that conversion. The following were also implemented alongside the one way system.

  1. a large number of parking spaces along Plassy Road were removed
  2. parking restrictions were introduced on Sangley Road and Brownhill Road
  3. bus stops had to be relocated.


Figure 1: Present Day Catford (Greater London United Kingdom)
Source: Google Maps

Impacts on Demand

Table 1 shows the vehicle flows over an typical day before and after the introduction of the scheme.

Table 1: Vehicle Flows) on a typical day (between 0700-1900) before and after scheme implementation

Road

Before

After

Change

Percentage Change

Rushey Green (North of Catford Road)

30,140

18,516

-11,624

-39%

Rushey Green (South of Catford Road)

18,235

18,318

83

0

Brownhill Road

13,742

18,240

4,498

33

Plassy Road

834

17,147

16,313

1,956

Sangley Road

5,400

17,996

12,596

233

One of the worst affected areas was Plassy Road which was a quiet residential street before the one way street system came into force. Following the introduction of the one way street system, total vehicle volumes rose by around 16000 per day of which approximately 3300 were heavy goods vehicles.

Impacts on Supply

No carriageway widening took place except for provision of additional crossing facilities. In essence therefore the system converted a series of two way roads into one way streets. As a result the capacity of the network was increased, though the scale of increase was not measured.

Contribution to Objectives

Objective

Scale of contribution

Comment

Efficiency

2

Vehicle Hours were reduced by 34% due to the one way system. However the one way system also increased vehicle miles travelled by about the same percentage (35%). While there must have been time savings, these would have accrued to private cars. On the other hand, 55% of pedestrians, car and bus users felt that their access was worse if attempting to access “the island” created by the one way system.

Liveable streets

Increased traffic noise was the main concern of residents in the survey area. Kerbside noise levels more than doubled during the weekday.80% reported that they heard more noise than they previously did and almost half were disturbed by the noise in the sleep.

However on Brownhill Road and Rushey Green there were some perceptible reductions in noise level as well.

Protection of the environment

Increased pollution was also thought to be an effect of the scheme, though no measurements were taken.

Equity and social inclusion

For mothers with children who had to cross Plassey Road to get to the Rushey Green primary school on foot, there was an increased perception of danger due to the volume of traffic.

Safety

There was a 40% decrease in accidents from 117 to 70 (comparing 2 years before against two years after implementation) and a 42% reduction in casualties (using the same basis of comparison 132 to 77).

There was a 50% reduction in accidents involving pedestrians.

Economic growth

Some businesses felt that being located on the island had led to the loss of business and in general 40% thought that the number of customers had decreased.

Finance

The scheme cost around £63,000 in 1970 prices.
1 = Weakest possible positive contribution, 5 = strongest possible positive contribution
-1 = Weakest possible negative contribution -5 = strongest possible negative contribution
0 = No contribution

Top of the page


Turning on Red (LTOR), Singapore

Context

In Singapore, traffic signals are the dominant type of traffic control with more than 1100 traffic installations. Singapore follows the British practice of driving on the left hand side of the road (unlike much of Europe or US). The policy of the Land Transport Authority (LTA) is that where possible and land space permits, dedicated channels of left turn slip roads are constructed so that vehicles intending to turn left can do so and merge with the cross flow under priority conditions. 

This case study examines the impact of a traffic management measure that allows for vehicles to turn left, after giving way to pedestrians and conflicting traffic even though the red indication is on.  This Turn on Red measure originated in the USA (and in that context, it is known as right turn on red since driving is on the right hand side of the road). In fact by 1947, California had allowed right turn on red unless expressly prohibited by traffic signs.  In 1997, the LTA implemented a traffic management measure known as Left Turn on Red (LTOR) at 50 intersections.

The anticipated benefits of turning on red, in common with other conventional traffic management measures, are primarily to reduce vehicle delays at intersections, reduce pollution and reduce energy consumption. It was also hoped that there would be a small increase in intersection capacity. At the same time, there was the fear that Turning on Red might lead to increase in accidents and their severity. Hence several criteria were used to select junctions where this scheme was to be implemented as follows:

  • Adequate sight distances particularly on approach to the intersection
  • Not obstructed by on street parking
  • High volumes of traffic using the LTOR lane
  • Only junctions with low accident history were eligible for the implementation
  • Low volumes of conflicting pedestrian especially young and infirm

Its intended operation was such that vehicles cannot turn left on red unless expressly allowed by the traffic signs.  The signage and general operation of the scheme in Singapore is shown in Figure 2.

Fig 02
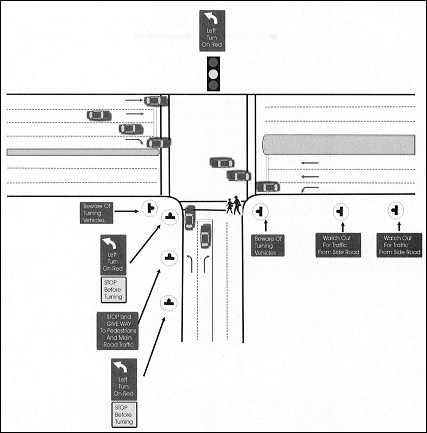
Figure 2: Junction Layout and Signs for LTOR (Source: Wong et al 2004)

Impacts on demand

Wong et al (2004) suggest that traffic volume increased on the approach roads where LTOR was implemented. The reason for this is unclear and could be due either to traffic rerouting to take advantage of this measure or it could have been due to generated traffic.

Impacts on Supply

The main impact in effect was to reduce the vehicular delays on the approach road. Wong et al (2004) reported reductions in delay (measured in seconds per vehicle) on the approach road of between 73 to 86% for 3 typical junctions where LTOR was implemented.

Impacts on safety

The evidence on increased accidents is mixed. On the one hand, accidents increased by 17% after LTOR adoption (for a sample of 36 sites surveyed) yet serious injury accidents fell by 62%. However addition, moving vehicle collisions increased by 38% but there was a large reduction in the number of vehicle-pedestrian accidents.

Contribution to Objectives

Objective

Scale of contribution

Comment

Efficiency

1

No direct evidence was provided, however it is likely that some modal shift has occurred, reducing congestion costs and improving efficiency. The generalised cost of bus travel will have also declined.

Liveable streets

1

No direct evidence was provided, however it is likely that some modal shift has occurred and that this has led to an improvement in liveable streets.

Protection of the environment

?

No direct evidence was provided, however it is likely that some modal shift has occurred, leading to a reduction in environmental externalities.

Equity and social inclusion

?

The extension of service will have opened up a wider range of services, goods and opportunities to those on low incomes.

Safety

2/
-1

No direct evidence was provided, however it is likely that some modal shift has occurred, which is likely to have lead to a reduction in accident rates.

Economic growth

?

No direct evidence was provided but it is likely that the improved service levels with no increased subsidy requirement will have been beneficial for the local economy.

Finance

?

The high service level elasticities suggest that increased fare revenue will have more than covered the cost of increased service provision.

1 = Weakest possible positive contribution, 5 = strongest possible positive contribution
-1 = Weakest possible negative contribution -5 = strongest possible negative contribution
0 = No contribution


Gaps and Weaknesses

All of these traffic management measures have been in place for some considerable time, and there is a lack of recent documented case studies.


Top of the page


Text edited at the Institute for Transport Studies, University of Leeds, Leeds LS2 9JT