|
|
 |
Bus rapid transitEvidence on performance Rede Integrada de Transporte, Curitiba, Brazil The information for this comes primarily from: Context
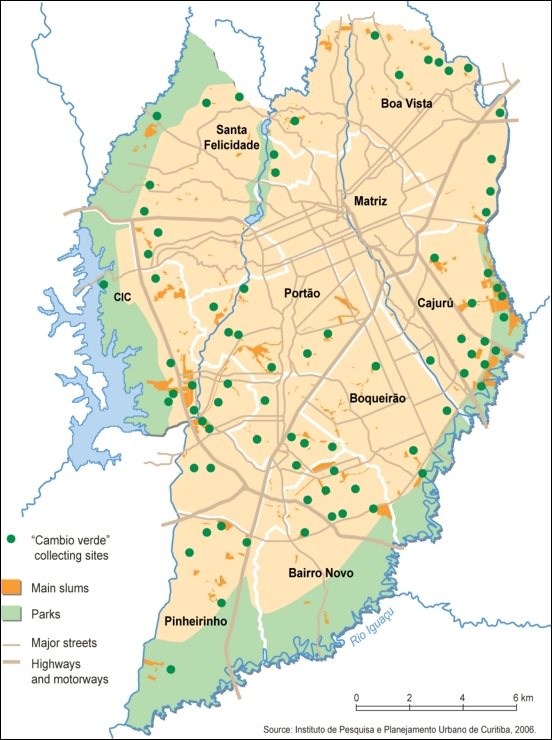
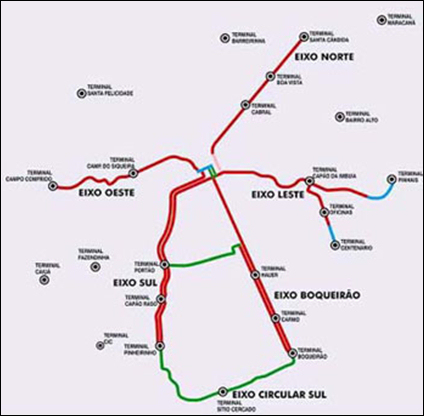
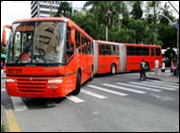
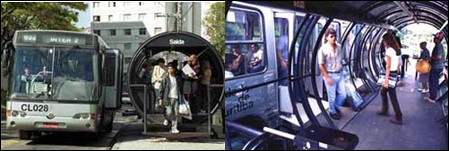
The bus system of Curitiba (Figure 2) in Brazil, exemplifies a model Bus Rapid Transit system. The BRT network is operated by URBS Urbanizacao de Curitiba) (http://www.urbs.curitiba.pr.gov.br). The buses run frequently - some as often as every 90 seconds - and reliably. Commuters ride them in great numbers, and the stops are convenient, well-designed and comfortable. Curitiba has one of the most heavily used, yet low-cost, transit systems in the world. It offers many of the features of a subway system -- vehicle movements unimpeded by traffic signals and congestion, fare collection prior to boarding, quick passenger loading and unloading -- but it is above ground and visible. The visibility is also useful as a marketing tool for public transport. Curitiba’s Master Plan integrated transportation with land use planning, with the latter as the driving force, and called for a cultural, social and economic transformation of the city. It limited central area growth, while encouraging commercial growth along the transport arteries radiating out from the city centre. The city’s central area was partly closed to vehicular traffic, and pedestrian streets were created. In addition, a strict street hierarchy (safeguarding rights of way for the current BRT) as well as politicians with strong commitment (in particular Jaime Lerner who has been considered by some to be the father of BRT) have contributed to the development of a showcase of BRT success. High-density residential and commercial development has been permitted within walking distance of stops, with much lower densities elsewhere in the city. The close co-ordination with land use has served to maximise the efficiency of the system and to ensure that stops serve well-developed, relatively high-density areas along five major structural transport corridors which are all dedicated busways (IEA, 2002) (see Figure 3).
Based on Master Planning, Curitiba’s bus system evolved in stages over the years since 1974 as phases of the Master Plan were implemented to arrive at its current form. This bus system is composed of three complementary levels of services that basically include the feeder lines, express lines and inter-district routes.
This BRT service, first introduced in 1974 is characterised by several features that enable Curitiba’s bus service to approach the speed, efficiency, and reliability of a subway system:
At present, the system carries over 532,000 passengers per day and has been extended to five busways with coverage of approximately 65km (Menckhoff (2005)). Impacts on demand Based on the results of a1991 traveller survey, it was estimated that the introduction of the BRT had caused a reduction of about 27 million car trips per year, and 28 % of BRT riders previously travelled by car). Compared to eight other Brazilian cities of its size, Curitiba uses about 30 percent less fuel per capita. This has also resulted in one of the lowest rates of ambient air pollution in the country. Today about 1,100 buses make 12,500 trips every day, serving more than 1.3 million passengers—50 times the number from 20 years ago. Eighty percent of travellers use the express or direct bus services (Goodman et al (2006a,b)). This is quite remarkable since Curitibanos (residents of Curitiba) both have both a higher than average automobile ownership than the rest of Brazil (one car for every three people) and a significantly higher per capita income than the national average, yet around 70% percent of Curitiba’s commuters use public transport daily to travel to work. Impacts on Supply The effective capacity of the current system is around 12,500 passengers per hour per direction operated by a variety of different bus types (see Table 2). (Note that some estimates of actual operating capacities are higher.) Table 2: Potential capacities of different bus services in Curitiba
Source: Frieberg (2000) Other Impacts The operation of bi-articulated buses might potentially pose a safety concern for cyclists although this does not appear to have been raised in the literature. Contribution to objectives
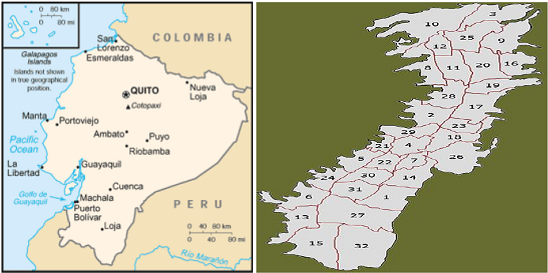
The information for this comes primarily from Levinson et al (2003) Context MetrobusQ or Sistema MetrobusQ (Metrobús de Quito) is a bus rapid transit system managed by the Empresa Metropolitana de Servicios y Administración del Transporte (EMSAT, http://www.emsat.gov.ec), the transportation agency of the municipality of the city of Quito, Pichincha Province, Ecuador (Figure 6).
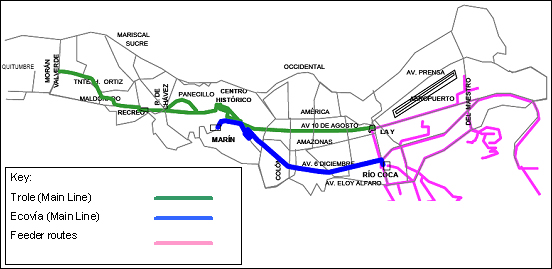
History The mountainous topography of Quito has constrained the city to grow in a linear form (Figure 7) approximately 30 kilometres in length and 3 to 5 kilometres in width. Prior to the introduction of BRT privately operated buses supplied all motorised public transport, with a fleet estimated informally at about 6,000 vehicles. In 1992, the existing bus fleet average age was 15+ years. One environmental impact of this was high noise pollution. Also, because older, conventional diesel buses do not operate efficiently at altitude1, emissions were a severe impact. Environmental pollution is an important political issue because of its adverse impacts on people, on the fabric of historical landmarks (In 1978, UNESCO awarded Quito World Cultural Heritage status), and on the important tourism industry. In particular WHO listed Quito as on it's at risk list for cities with high pollution levels. In the early to mid-1990s, standards of public transport were low, characterised by slow journey times, chaotic service levels, overcrowding, and as a result of controlled fares policies, lack of investment for bus fleet renewal. Improvement of public transport became a political imperative, and a “clean” system was sought in view of the city’s cultural heritage. Project planning for an integrated public transport system, of which the Quito Trolebus scheme along the major north-south corridor forms the key component, commenced in 1990 and became operational in 1996. Two other lines were added and the Trole line was extended in 2000. The network is shown in Figure 8 and Table 3 provides design details.1 Quito is 2850 meters above sea level (the second highest administrative capital city in the world after La Paz in Bolivia
The Trole line runs mostly on a fully segregated busway, located in the middle of relatively wide avenues, and includes three major terminals permitting free transfers to/from feeder buses. It also passes through the historic city centre – included in UNESCO’s World Heritage List – which has an intricate system of streets that are rarely wider than two lanes. In this case, the bus way is discontinued and the buses run on bus only streets. Hence BRT demonstrates its flexibility, providing high-quality public transport access to an area that is more suitable for pedestrian movement than motor vehicles. However, this comes at the price of a somewhat restricted line-haul capacity (about 8,000 passengers per hour per direction) and a relatively low commercial bus speed (10 km/h in the central area, the main reason why the overall terminal-to-terminal speed is only 15 km/h). Distinct from the other BRT systems in Latin America, the Trole line is government-owned and operated; the two more recent diesel-bus BRT lines are operated by private consortia under 12-year concessions. Unfortunately, there is no operational integration among the three lines at this stage, and passengers cannot transfer between them even though at two locations some lines pass through the same street. The current arrangements are the result of separate business negotiations with individual groups of private bus operators that had to be coaxed into collaborating with the BRT reform. Quito intends to address this lack of integration which is mostly due to institutional (rather than technical) reasons. All sixteen private bus companies that operate buses on these lines are earning an operating profit and are not subsidised by the government.
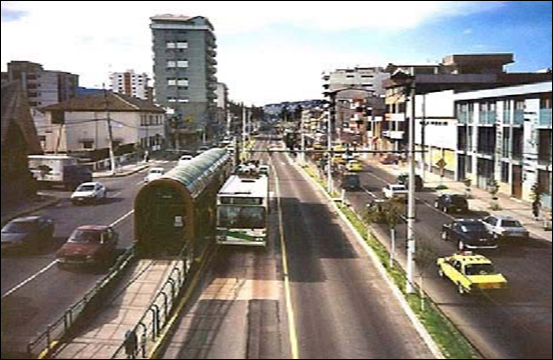
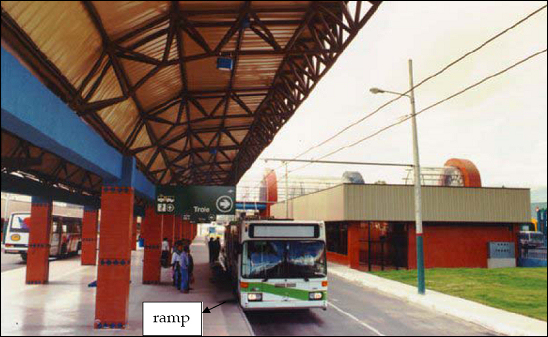
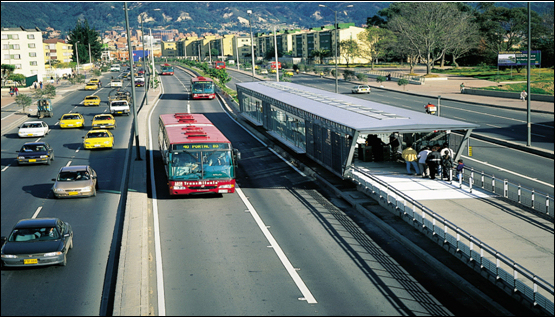
Note though that based on Figure 9, the infrastructure (given the barrier between lanes on the right of the picture) could be adding to a serious severance problem, which likely to have a negative impact on liveability, and social inclusion. However the following Figure 10 shows also that some of the buses are able to dock (without guidance) very close to the kerb and allow for level boarding enhancing social inclusion especially for passengers with disabilities.
Impacts on demand The three lines have surpassed predicted demand of 140,000 passengers/day by carrying an average of 170,000 passengers/day; such volumes have enabled operation and maintenance costs to be met by fare box revenues. With the extension of the Trolebus line to the southern part of the city, the volume is expected to increase to 230,000 passengers per day. Impacts on Supply There was a total reorganisation of the bus system. In addition introduction of the busway system enhances the level of service to passengers by much increased operational hours compared to the pre-busway system, which terminated officially at 8.00 pm on weekdays. Currently the buses run till at least 00:30 am. Contribution to Objectives
The information for this comes primarily from the following sources: Context
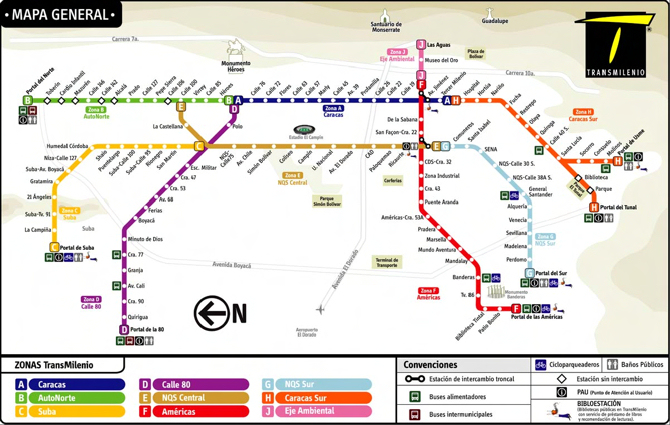
TransMilenio (Figure 11) plays a crucial role in the development of BRT because this is the first application to a very dense capital city (240 habitants per hectare2) which demonstrates that BRT can provide the capacity to accommodate passenger throughputs approximating and even exceeding that which can be offered by light rail at a fraction of the cost (Sandoval and Hidalgo-Guerrer, 2004; Hook, 2005; Cain et al 2006; Wright and Hook, 2007). Bogotá is the capital of Colombia. Prior to the implementation of the BRT, the bus system comprised a wide range of bus types and services. The system resulted in some of the largest bus flows and congestion in the world; during rush hours, bus flows of over 1,000 buses/hour/direction were recorded on a single road. Improvements in public transport became a political imperative, and the Mayor Enrique Peñalosa Londoño adopted a policy with the following objectives as part of his mobility strategy:
Earlier in the history of Bogotá, metro and elevated highways were proposed but financing them proved to be difficult and innovative solutions had to be sought (Sandoval and Hidalgo-Guerrer, 2004). Amongst the elements implemented as part of the Mayor’s Mobility Strategy, the most important was BRT (known as the TransMilenio). TRANSMILENIO SA (http://www.transmilenio.gov.co) is the governmental department owning and regulating the system. The services are contracted out via concessions to private operators and feeder service operators who are paid on the basis of vehicle kilometres operated. Table 4 describes the first two phases. Table 4: TransMilenio BRT System in Bogotá, Colombia
The fact that TransMilenio carries very high passenger volumes of up to 35,000 passengers per hour per direction (and exceeds the capacity of light rail systems) is due to a variety of system design features:
2 By comparison London has a density of approximately 60 inhabitants per hectare.
Impacts on demand TransMilenio has induced some shift to public transit. 9% of surveyed riders stated that before TransMilenio they made the same trip by private car. However, this is also due to car use restrictions (“Pico y placa”) where 40% of cars are banned from using roads in the peak periods (7:00 to 9:00 a.m. and 5:00 to 7:00 p.m.) identified by the last number of the licence plate (Cain et al, 2006; Wright and Hook, 2007). Impacts on Supply TransMilenio Phase I, implemented between 1998 and 2002, consists of 41 Km of exclusive busways, 61 stations, 470 articulated buses and 235 feeder buses. This has therefore increased the supply of public transport dramatically. The system is currently under expansion for 40 additional km. The longer term plan for the year 2020 is intended to provide a network such that 85% of the city area will be within 500 metres of the trunk system (Hidalgo-Guerrero, 2004). Air Quality Impacts When Phase 1 was introduced TransMilenio had a positive impact on air quality in the corridor resulting in 43% reduction in sulphur dioxide, an 18% reduction in nitrogen dioxide, and a 12% reduction in particulate matter (Cain et al 2006). However, for the city as a whole, particulate matter has increased by 12% and sulphur dioxide has increased by 15%, while nitrogen dioxide, carbon monoxide, and ozone have been reduced. Contribution to Objectives
Context The O-Bahn in Adelaid was opened in 1986 and is the worlds longest guided busway. It traces a 12km north-easterly route from 3km north of the centre of Adelaide out to a major regional shopping center at Modbury, 15 km from the city center. It is grade Separated from the road system and has only two intermediate stations so as to minimize travel time. Both intermediate stations are at locations where the corridor intersects major cross-town roads: at Paradise (9km from the city) and at Klemzig (6 km from the city). Park-and-ride facilities, with total parking for approximately 1000 cars, are provided at Modbury, Paradise and Klemzig. The system was opened in two stages, the first of which - between the city boundary and Paradise - commenced public operation in March 1986, with the full system then opening in August 1989. Buses start their inbound journey at a suburban terminus, spend approximately a third of their journey on suburban streets, join the O-Bahn at either Modbury or Paradise for travel to the edge of the city; buses then leave the guideway and continue the 3km into the city centre along public roads, on which bus priority is provided. The O-Bahn group of services are privately operated under contract to the government by a single franchisee. For more information see http://www.adelaidemetro.com.au/guides/obahn.html Impacts on demand Overall travel, journey length and destination Before-and-after surveys, undertaken in 1985 and 1991, indicated that weekday public transport patronage in the O-Bahn corridor rose by 8.5 percent immediately following opening of the first stage and rose a further 9.4 percent immediately following opening of the second stage. In total, patronage increased by 22.2 percent over that whole period. it is estimated that, in 1991, public transport patronage on bus services in the O-Bahn service area were 50 percent higher than would have been the case without the O-Bahn. Patronage on bus services using the O-Bahn remained broadly constant between 1991 and 1998, whilst patronage on the remainder of Adelaides public transport system over this period has declined. In 1998 there were approximately 20,000 passenger trips on the 0-Bahn each weekday and it was estimated that about 20 percent of passenger trips on the O-Bahn use one of the three park and ride facilities. Choice of mode The final After survey, in 1991, indicated that 14 percent of users of the O-Bahn had previously been car drivers and 5 percent had been car passengers. The same survey indicated that 65 percent of O-Bahn users had previously been bus users, and 10 percent were new trips. Time of travel No impact recorded. Route The final After survey, in 1991, indicated that 6 percent of users of the O-Bahn had transferred from bus services in neighboring areas. Impacts on supplySeveral bus routes enter the busway at Modbury and at Paradise. Average peak period headway between the Paradise interchange and the city is approximately 50-s, whilst in the daytime off-peak, a five minute headway is operated on the busway, with feeder buses serving the Modbury and Paradise interchanges on routes with less traffic. Headways during the late evening and weekends range between 12 and 15 mins, during which time extensive use is made of feeder services. Most services stop at both Paradise and Klemzig, though some services operate express. Buses using the O-Bahn have travel times around 10 mins faster than when they used the arterial road system (on which considerable bus priority [link to bus priority] had been provided). Travel time between Modbury and the city is 22 mins on stopping services and 20 mins on express services. The bus fleet using the O-Bahn comprises approximately 110 buses, half of which are articulated. Importantly, the O-Bahn represented a significant increase in public transport capacity within Adelaide. It is thought that the capacity of the O-Bahn is unlikely to ever be a constraint, as it has been estimated that with a 20-s headway and use of articulated vehicles an hourly capacity of 18,000 passengers in each direction could be provided. Contribution to objectives
* Readers are cautioned against using the cost of the O-Bahn as a guide to the cost of constructing a guided busway in other circumstances. Three factors, in particular, increased the cost of the project (1) the highly expansive clay soil in the corridor; (2) the large number of bridges resulting from location of the busway in a river corridor; and (3) the development of a linear park together with the O-Bahn project.
Leeds Superbus A61 (Scott Hall Road) Context The guided bus system on Scott Hall Road in Leeds, branded as Superbus, was launched in 1995. Scott Hall Road is a well-defined, radial corridor of dual carriageway status to the north of the city. Bus was not traditionally regarded as a significant mode along the corridor. In contrast with the O-Bahn in Adelaide which uses a continuous guideway along a wholly separate right of way, the Leeds scheme uses a series of relatively short stretches of guideway on or immediately adjacent to an existing road at particular points where traffic congestion occurs. The guideway was completed and opened in sections, the first of which opened for operation in September 1995 and the third and most recent of which opened in 1998. Impacts on demand Overall travel, journey length and destination The operator has recorded increases in patronage of over 75% and 50% reductions in peak journey time since the opening of the first section of the guideway in 1995 (Dark, 2001; and Bain, 2002), whilst patronage on other services has been in decline. However, only around 6% of passengers reported using the bus as a result of the guided bus facility. It appears that others have been prompted to do so when changing job or home (Daugherty and Balcombe, 1999). Choice of mode The operator estimates that between 10% and 20% of new passengers have shifted from car (Bain, 2002) and that this equates to approximately 500 car drivers per week (Firstgroup, 2000). Daugherty and Balcombe found little direct evidence of a reduction in car use (Daugherty and Balcombe, 1999), but it may well be that those using the bus after changing job or home would previously have travelled by car. Time of travelThere is no evidence of users changing the time at which they travel. Route There is some anecdotal evidence to suggest that some passengers have diverted to the guided bus service on Scott Hall Road from nearby parallel bus corridors, perhaps abstracting from patronage on those parallel routes. Impacts on supplyIt has been estimated that travel times were reduced by an average of 70 seconds over a 4km length, but some buses were faster than cars over the route. Furthermore, variability in bus journey times fell by 75% (Daugherty and Balcombe, 1999). In addition to the guideway itself, the scheme included new state of the art accessible vehicles for operation of the service, special tailor-made information at stops, new shelters and a park and ride site towards the outer end of the route. Furthermore, in response to the increased patronage and reduced journey times experienced since the opening of the scheme, the operator has introduced a revised timetable with more frequent buses. Only minor adjustments were made to the vehicular capacity of the road, as guideway was only installed along a limited number of key sections of the route and some of these run along the central reservation. However, in contrast to the O-Bahn in Adelaide where the guideway represented an increase in public transport capacity without any reduction in road capacity for other traffic, the Leeds scheme has involved a slight reduction in road capacity for other traffic. Contribution to objectives
The financing was via a Public Private Partnership (PPP) which involved
First Leeds (the bus operator) who provided the new, high quality accessible
guide-wheel equipped vehicles, Leeds City Council (the local highway authority)
who provided the guideway and associated bus priority measures and Metro
(the local public transport planning authority) who provided information,
new shelters and stops.
Text edited at the Institute for Transport Studies,
University of Leeds, Leeds LS2 9JT
|
|||||||||||||||||||||||||||||||||||||||||||||||||||||||||||||||||||||||||||||||||||||||||||||||||||||||||||||||||||||||||||||||||||||||||||||||||||||||||||||||||||||||||||||||||||||||||||||||||||||||||||||||||||||||||||||||||||||||||||||||||||||||||||||||||||||||||||||||||||||||||||||||||||||||