LinksGlossaryMessagesSitemapHelp


Home

Policy Instruments

Select
Search
Filter
Parking Guidance and Information systems
SummaryFirst principles assesmentEvidence on performancePolicy contributionComplementary instrumentsReferences

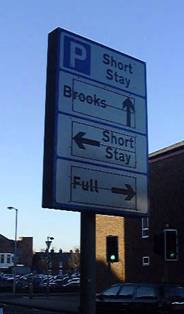
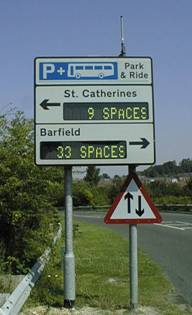
Evidence on performance

Parking Guidance and Information System in Southampton , UK .

The case study reported here is taken from ‘Evaluation Results and Comparative Assessment, Southampton Case Study’ prepared by Heusch/Boesefeldt GmbH for EUROSCOPE-TR 1023.The report was produced in 1999.

Context

Prior to 1992, rotating prism car park VMS were used to display one of two legends; ‘full’ or ‘spaces’ in Southampton. Later as a part of the ROMANSE Project, a new city-wide system of car park VMS combining directional as well as occupancy number information, has been installed. Two of the signs, which are further out from the city centre, display the total number of spaces in each of the three city centre areas, while others display information for named car parks (Figure 1). At the end of 1996, the rotating prism signs were replaced by dot-matrix signs and a further seven dot-matrix car park VMS were installed as part of the ENTRANCE project. The ROMANSE pilot project has been expanded within the framework of the ROMANSE II - EUROSCOPE project and has moved from an experimental pilot project to a full demonstration project in daily operation, with wide implementation of the integrated traffic management measures. There is now a total of 26 car park signs providing real-time information of the number of spaces available in each of the main off-street car parks.

Figure 2 illustrates the system structure. Vehicles entering and leaving the car parks are detected traversing the loops in the entry/exit lanes of the car parks and the data is transmitted to the control centre where, at two minute intervals, the number of vacant spaces in each car park are calculated and passed to the signs on street. Off-street parking in the city was divided into three main areas. Signs for these areas and associated car parks were colour coded. This was to enable drivers to identify car park information which was relevant to the area of the city they wanted to visit.

Figure 1: Southampton parking guidance information system


Rotating prism PGI Dot-matrix PGI

courtesy of Hampshire County Council (http://www.mobiservice.org.uk/hants_info.htm)

Figure 2 Southampton PGI System Structure

Courtesy of Hampshire County Council (http://www.mobiservice.org.uk/hants_info.htm)

There are some 4,000 off-street parking spaces in Southampton city centre and, overall, there is adequate parking in the city, except possibly during the busy Christmas shopping period and the Boat Show period (Southampton Boat Show is the busiest in Europe ). The parking guidance signs are located in Southampton city centre and on approach roads shown in Figure 3.

Figure 3 Parking Guidance VMS Location Plan

source: EU EUROSCOPE (1999)

Impacts on demand

The parking guidance VMS were evaluated using questionnaire interview surveys on two previous occasions; December 1994 (within ROMANSE) and December 1996 (within ENTRANCE). Further questionnaire surveys were undertaken during the Boat Show week in September 1998 and the pre-Christmas period of December 1998. At this time the complete parking guidance system had been operating successfully in Southampton for the previous 18 months, and so the majority of the road users were accustomed to this type of real-time information.

Table 2 compares the results of all surveys undertaken in Southampton to investigate the effectiveness of the parking guidance signs since the introduction of the pilot system in 1994. Before the city-wide upgrading to dot-matrix signs, only 38% of drivers who noticed a PGI sign looked at the information (this survey was undertaken in December 1994). In subsequent surveys, this figure rose, and varied from 58% to 74%. It was found that the proportion of drivers looking at the information is higher for drivers visiting the city centre less frequently, and greater at times of peak parking demand. 34% to 41% of drivers said they ‘always’ or ‘nearly always’ use the parking guidance signs. Overall, some 8% of the sample claimed to have changed their parking destination as a result of the information.

Table 2 Comparison of results from all Parking Guidance Sign surveys undertaken in Southampton (EUROSCOPE, 1999)

Some Highlights

Dec 94

Dec 96

Sept 98

Dec 98 (Signs not working)

Dec 98

Sample size

835

347

979

437

348

% of people who had decided to park in a specific car park BEFORE setting off on their trip

81%

(676)

85%

(295)

83%

(813)

80%

(350)

86%

(299)

% of people who ‘always’ or ‘nearly always’ use the parking guidance signs

n/a

35%

34%

36%

41%

% of people who found it either ‘very easy’ or ‘easy’ to find a space

85%

(710)

91%

(316)

87%

(852)

91%

(398)

96%

(334)

% of people who noticed a parking guidance sign on their way to the car park

58%

(484)

65%

(226)

62%

(607)

61%

(267)

64%

(223)

Of these, % of respondents who looked at the information

38%

65%

58%

67%

74%

Of these, % who claimed that they changed their parking destination as a result of the information

36%

(66)

11%

(16)

17%

(60)

9%

(16)

17%

(28)

Therefore, % of the total sample who changed their parking destination

7.9%

4.6%

6.1%

3.7%

8.1%

% of people who think that such signs are ‘necessary’ in Southampton

90%

(752)

94%

(326)

92%

(901)

93%

(406)

91%

(317)

Note: there are some inconsistencies between the different surveys (see details, EUROSCOPE, 1999)

It appears from the results of the interview surveys and the car park occupancy surveys that demand for parking does not yet exceed supply, even at peak periods such as the Boat Show and the pre-Christmas Saturday shopping. The majority of drivers do not usually need parking guidance information, but they think it is necessary, perhaps to assist them at certain times when there are fewer spaces available. This is because 80-86% of drivers decided to park in the car park (where they were interviewed) before they set off from their home and 85-96% of drivers found it ‘easy’ or ‘very easy’ to find a parking space. At a point in the future when demand outstrips supply, the signs are expected, in theory, to have much more benefit.

Impacts on environment

Another EU Project, CONVERGE (2000) estimated the environmental impacts of the introduction of citywide dot-matrix PGI signs in Southampton . These estimates were based on differences in the ‘before’ and ‘after’ times spent searching and queuing for parking spaces and other information such as, speed related emission factors from the HBEFA manual on emission factors, idling emission factors from the MODEM emissions model and fleet composition data. It was estimated that these reductions could be 6% and 15% of the fuel consumption and pollutant emissions for a 10km and 3km trip respectively during the periods of high demand (Converge-D3.3.1, 2000).

Finance

A cost-benefit calculation was made for SouthamptonPGI based on the cost of installation and maintenance of the dot-matrix PGI signs and the benefits associated with the reductions in the times spent searching and queuing for parking spaces. The benefits included reductions in distance travelled, time spent parking, vehicle operating costs and fuel consumption. The value of time used was £8 per hour. Based on the assumption that the reductions in the times spent searching and queuing for parking spaces would apply to 79 days per year over a period of 5 year, PGI system was found economically viable with an economic rate of return of 91%. This showed that over a five year period the benefits outweigh the cost of installation and maintenance in Southampton (Converge-D3.3.1, 2000).

In general PGI systems are implemented part of an integrated urban traffic management system. This was also the case in the Southampton PGI that combined by the STOPWATCH, TRIPlaner and ARTEMIS projects (see Converge 2000 for details) in order to provide real time travel information and guidance cross modes. The total cost of the ROMANSE pilot and ROMANSE II demonstration is given in the following table.

Table 3 Cost figures for ROMANSE and ROMANCE II

Costs in Million EUR

ROMANSE pilot

ROMANSE II demonstration

R&D

1.3

1.3

Infrastructure

8.50

9.55

Evaluation

0.74

0.95

Other

0.70

0.45

Total

12.3

11.2

http://www.rec.org/REC/Programs/Telematics/CAPE/goodpractice/trnsprt/doc/SOUTHAMPTON.doc )

Barriers & Conflicts

Securing medium to long-term funding was thought to be harder to do when the ROMANSE products are implemented county wide. It is expected that it may also create technical hitches due to moving from the pilot schemes to wider implementation (REC, 2004).

On the other hand, political conflicts were effectively avoided by implementing the PGI part of the integrated policy of the region. However what is not clear is the legal responsibility of travel information provision which might lead to legal action if wrong information were to lead to financial losses for users, or operators.

Parking Guidance and Information Systems, Japan

The case study reported here is taken from ‘ Japan Institute of Contraction Engineering’s Regional Intelligent Transport Systems (ITS) Website’ that designed as an aid to measure the benefits of regional ITS. The regional ITS casebook titled ‘Benefits from ITS Deployment in Japan’ has been created to provide an overview of the magnitude of the benefits of various services being considered for adoption and to provide information that will help when explaining the usefulness of regional ITS to a third party.

Context

This case study evaluates the benefits of Parking Guidance and Information provision implemented in fours cities in Japan . Figure 1 shows the expected benefits from PGI systems and their evaluation criteria with the representative measures used in these case studies.

Figure 1 Classification of benefits and the method used to assess these benefits

source: ITS Policy Program Division, Road Bureau Ministry of Land, Infrastructure and Transport , Japan

Increase in efficiency and use of parking

(1) Dispersed use of parking facilities

In Toyota City , the occupancy rate of an underground parking facility at Shin-Toyota Station, one of the most crowded parking places, was reduced from 130% to 117% after the introduction of parking information signs. Figure 2 shows the gradual reduction in occupancy rate to 111% following the launch of the web-based and cellular phone-based services that allows drivers to get information prior to their departure.

Figure 2 Changes in occupancy rate of Shin-Toyota Station underground parking

source: ITS Policy Program Division, Road Bureau Ministry of Land, Infrastructure and Transport , Japan

(2) Reduction in waiting time before parking

At the same parking place in Toyota City, gradual introduction of the same parking guidance systems decreased the waiting time for vacancies by more than half (Fig. 3).

Figure3 Changes in waiting time for vacancies at Shin-Toyota Station underground parking

source: ITS Policy Program Division, Road Bureau Ministry of Land, Infrastructure and Transport , Japan

Smoothing traffic flow

(1) Reduction of illegal on-street parking

After the introduction of a parking guidance system In Sapporo City, the number of vehicles illegally parked on streets was reduced dramatically: a quarter on weekdays and halved at weekend and holidays.

Figure 4 Changes in number of vehicles illegally parked on streets

source: ITS Policy Program Division, Road Bureau Ministry of Land, Infrastructure and Transport , Japan

(2) Reduction of wandering vehicles

In Toyota City , surveys showed that the average time required to park, measured from the time a car arrives in the central part of the city to the time the car is parked, was reduced from 12 minutes to 6 minutes. Similarly in Okayama City, 50% of the respondents feel that the time required to park has been (will be) reduced by about 10 minutes to 15 minutes, and the actual time reduction reported was averaged 13 minutes (Fig. 5).

Figure 5 Reductions in time required to park in Okayama City

1. The figures above indicate time reductions reported by respondents who thought the time required to park had been or will be reduced. 2. Even if the respondent had never used the system, he/she was asked to respond by assuming the use of such system. (source: ITS Policy Program Division, Road Bureau Ministry of Land, Infrastructure and Transport , Japan )

(3) Alleviation of traffic congestion

In Sapporo City , it is reported that the degree of congestion measured at a point on National Highway Route 36 ( Sapporo Ekimae-dori) decreased by 0.28 point from 0.74 to 0.46. In Toyota City , the vehicle kilometres travelled by vehicles using parking facilities decreased by 47%. It is also reported that the number of vehicles illegally parked on streets also decreased. PGI systems have contributed to the alleviation of traffic congestion in both cities.(Fig. 6).


Figure 6 In-vehicle kilometres travelled by vehicles using parking facilities


Improvement of environment

(1) Reduction in air pollution and global warming

In Toyota City , CO2 and NOx emissions from vehicles using parking facilities have decreased dramatically in line with decreases in search traffic and parking queues (Fig. 7).

Figure 7 Changes in CO2 and NOx emissions from vehicles using parking facilities


Enhancement of user satisfaction

(1) User convenience

In a questionnaire survey conducted in Okayama City , more than 90% of system users said that the time required to find parking and the time spent waiting for vacancies had shortened, and irritation had been or will be eliminated. About 70% of users replied that uneasiness associated with finding a parking space had been or will be eliminated. (Fig. 8).


Figure 8 Elimination of irritation and uneasiness of parking search


(2) Utility and intention of use

According to a questionnaire conducted in Toyota City, from all the different information techniques (electronic sign, internet and phone based PGI) being used, more than half of users are satisfied with cellular phone-based information services, while only about one third are satisfied with parking information signs alone (Fig. 9).

Figure 9 Effectiveness of PGI system in central Toyota City


A survey by the Toyota Municipal Government indicates that the ratio of location change is as high as 90% among cellular phone-based information recipients, suggesting that cellular phones will become a very effective information medium as they become more widespread (Fig. 10).


Figure 10 Parking change ratio by information medium


Sapporo City also provides telephone-based PGI service (fax-on-demand information service). The number of accesses to this service has nearly quintupled from 1994 (371 request) to 2000 (1467 request).

Other Studies

Other studies can be used to show the general benefit on several aspects affected by Parking Guidance and Information Systems:

  • Travel time : The evidence from Southampton .(Converge-D3.3.1, 2000) and Frankfurt-am-Main(Axhausen et al., 1994) indicates that parking guidance information reduces the average time spent parking at times when there is a large demand for parking. Results from surveys in Southampton at different times of year found that drivers using city centre car parks reduced the average time spent searching for a space by 50% - from 2.4mins to 1.2mins.
  • Destination : In Southampton , 7% to 12% of drivers who notice parking guidance information changed parking destination due to it. A survey of over 600 people in Valencia , Spain found that 61% of drivers’ route choices were influenced by the information on VMS signs and 30% had changed their parking destination as a result. In both cities it was observed that a substantially higher proportion of infrequent visitors change parking destination due to parking guidance information (Converge-D3.3.1, 2000).
  • Diversions : “A study in Leicester examined the effect of parking guidance information on arrival rates at car parks and found that changes in the reported availability of parking spaces significantly influenced arrival rates at relevant car parks.” (Wright and Withill 1992). Information relating to Park and Ride has been measured to have a very small impact on the numbers of drivers using Park and Ride (Converge-D3.3.1, 2000).
  • Travel distance and speeds : An optimization model (Thompson, 2001) showed that PGI minimizes parking queues by spreading the excess demand between the number of facilities having an adequate supply of parking. Thus the total distance travelled can also be reduced, by directing cars away from the central car parks to other available car parks near their entrance links. This can potentially reduce vehicle emissions as a consequence of increasing average vehicle speeds within that area such as a city centre.
Congestion : A number plate survey in Torbay (UK), a seaside resort, showed that parking guidance information decreased queuing slightly at popular car parks and increased patronage at a less popular car park (Andrew and Hillen 1980). In Utsunomiya , Japan , there were 74% (weekday figure) fewer vehicles observed to be queuing at the entrance of car parks (Thompson, 1998) as a result of introduction of a PGI system.


Top of the page


Text edited at the Institute for Transport Studies, University of Leeds, Leeds LS2 9JT