Where to Use Cost Effectiveness Techniques Rather than Cost Benefit Analysis
(Developed from
The Handbook on Economic Analysis on Investment Operations (World Bank, 1998 [[1]])
and Lebo and Schelling (2001) [[2]].)
Part of Toolkit for the Economic Evaluation of World Bank Transport Projects
(Institute for Transport Studies, University of Leeds, 2003)
Cost Benefit Analysis, and the measures of economic performance that can be derived from it (see Note When and How to Use NPV, IRR and Adjusted IRR [Link]), is the preferred method for demonstrating the economic justification of transport investments. Such an approach, however, relies on the ability to be able to measure costs and benefits in monetary terms (see Framework [Link]), which renders it problematic for projects where the majority of benefits cannot be readily monetised. Such a project could be a Low Volume Rural Road (see Note Low Volume Rural Roads [Link]). In such situations consideration should be given to the use of measures derived from cost effectiveness or weighted cost effectiveness (also known as Multi Criteria Analysis) techniques as the basis for the decision regarding whether to invest or not.
Cost effectiveness techniques are also a very useful tool for project screening or ranking. Such a screening process ensures that projects that are subjected to a more detailed analysis (including cost benefit analysis) are those that best fit with the objectives of the investment (e.g. poverty alleviation).
Section 1 of this note outlines the situations in which cost effectiveness techniques should be used, whilst Section 2 describes the two main types of approaches. Section 3 discusses the issue of economic viability and cost effectiveness whilst Section 4 presents a summary of recommendations.
1 Application of Cost Effectiveness
Selection and priority-setting methods consist of two broad types of methodologies that are usually applied in succession: (a) screening and (b) ranking. Cost effectiveness can form the basis of both methods. Screening decreases the number of investment alternatives given budgetary constraints, whilst ranking as the title suggests prioritises the alternatives that have been “shortlisted” from the screening process.
The economic justification for investment in one of the shortlisted projects should be made using cost benefit analysis criteria, however, under certain circumstances cost effectiveness criterion may be used instead.
Cost Effectiveness as a Project Screening and Ranking Tool
Transport investments form part of an overall investment strategy that has pre-determined objectives, such as the alleviation of poverty. Screening and ranking methods would determine those projects that contribute most strongly towards the achievement of these objectives.
For example, with a primary objective of poverty alleviation, one of the purposes of screening would be to target investments to disadvantaged regions, local governments and communities. Screening approaches were developed initially for targeting isolated or economically deprived communities and regions. They have since been adapted for the selection of districts, communities, and municipalities on the basis of poverty criteria - measuring economic standing and potential, as well as social development (such as literacy and health statistics). In China, for example, poverty-based pre-screening was used to identify “priority counties.” A second- and third-stage screening process was then used to identify specific road sections and corresponding design standards (see Box 1).
Box 1: Selecting Road Improvement Components for Poverty Alleviation
|
Two recent Bank-financed highway projects
in China (Second Henan Provincial Highway Project, 1996, and Second Shaanxi
Provincial Highway Project, 1996) included a poverty-focused component. The
component was proposed in line with the provincial government programs of
Road Improvement for Poverty Alleviation (RIPA), which aimed to provide
all-weather access through rehabilitation, upgrading, and construction of
rural roads to a main provincial road axis for every poor county township and
the majority of villages. A three-stage screening procedure was
developed to select rural roads to be included in the project’s RIPA
component. The first stage of screening identified the “priority counties”
that were most in need of improved road transport as an element in
alleviating their poverty. The criteria used to prioritise included average
income per capita, number of the “very poor” per 10,000 population, value of
agriculture production, value of mineral production, and other social
development indicators (including literacy rate, health workers per thousand
population, and access to clean drinking water). The second stage of
screening used a cost-effectiveness criterion to select rural road systems
from these priority counties. In this stage, rural roads for improvement in
these counties were grouped into the RIPA systems based on three criteria:
(1) continuity of the system; (2) maximisation of the population served; and
(3) connectivity to as many settlements as possible. Then a
cost-effectiveness criterion - the proposed investment cost divided by
population served in the influence area of the system - was used to screen
the RIPA road systems. The very high unit cost systems were dropped. Finally,
available financial resources were taken into consideration in deciding the
number of systems and size of the RIPA packages that passed this stage of the
screening. The third stage of
screening consisted of an analysis of the economic and social benefits of
each of the road systems included for consideration at the end of the second
stage. The analysis also included a review of motorisation trends to guide
the selection of proper road class and road engineering design that would
meet the future needs of both motorised and non-motorised traffic in these
rural areas. |
Source: Hajj and Pendakur [[3]].
Another use of screening is to eliminate low priority links or projects from consideration for investments. For example, in the case of the Andhra Pradesh district transport master planning process in India, it was decided that for each village only one link, normally the shortest one, would be upgraded to basic access standard. This reduced the road network that was considered for interventions from about 5,000km to 3,000km per district.
Cost Effectiveness as a Decision Tool for Investment
The operational policies of the World Bank (World Bank, 1994 [[4]]) allow the use of cost effectiveness criterion as a basis for the decision regarding whether to invest in a particular project, over a set of alternative projects, in situations where benefits cannot be measured in monetary terms, or where measurement is difficult. However, in addition to these constraints the following conditions must also be satisfied before cost effectiveness techniques are used:
(a) The objectives of the intervention must be clearly stated and be part of a wider program of objectives (such as poverty alleviation); and
(b) The intervention represents the least-cost way of attaining the stated objectives.
The types of projects that are most suitable for the application of cost effectiveness techniques are therefore those where social benefits form a significant or majority part of the anticipated scheme benefits, such as Low Volume Rural Roads (see Note Low Volume Rural Roads [Link]).
Within the context of Low Volume Rural Roads, the “Least-cost” criterion means that “basic access standards”[*] are utilised. In order to provide as many poor rural dwellers as possible with basic access, total life-cycle costs for investment and maintenance are minimised. In most cases this will mean single-lane, simple design standard and spot-improved gravel and earth roads for the access to the villages, allowing all-season access, but permitting interruptions during severe weather, and improved paths and provision of footbridges for the intra- and near village transport network. The rationale behind this is that the relatively high benefits to be derived from the opening up of, usually, motorised access to communities can be achieved without risking high investment. If, later, traffic grows considerably to certain communities, further improvement of the access route can be subject to the same economic analysis as that applied to rural roads in general.
2 Cost Effectiveness techniques
The World Bank’s Handbook on Investment Operations (World Bank, 1998 [1]) sets out the two main techniques for comparing projects whose benefits are not readily measurable in monetary terms: cost-effectiveness analysis and weighted cost-effectiveness analysis (or Multi-Criteria Analysis). The main difference between the approaches is the measurement of benefits. If the benefits are measured in some single non-monetary units, such as the number of people that live within a day’s walk of a road, the analysis is called cost-effectiveness. If the benefits consist of improvements in several dimensions, for example total population and the number of poor, then the several dimensions of the benefits need to be weighted and reduced to a single measure, and the analysis is called weighted cost effectiveness (or Multi-Criteria Analysis).
The choice of technique depends on the nature of the task, the time constraints, and the information available. Cost-effectiveness is appropriate whenever the project has a single goal that is not measurable in monetary terms: for example, to provide education to a given number of children. Weighted cost-effectiveness is appropriate when the projects or interventions aim to achieve multiple goals that are not measurable in monetary terms. For example, there might be several interventions that simultaneously increase reading speed, comprehension, and vocabulary, but that are not equally effective in achieving each of the goals. Comparing among methods to achieve these aims requires that we reduce the three goals to a single measure, for which we need some weighting scheme. All evaluation techniques share some common steps: the analyst must identify the problem, consider the alternatives and select the appropriate type of analysis. In this chapter we provide the tools for identifying the costs and benefits and assessing whether the benefits are worth the costs.
Cost Effectiveness Analysis
Cost Effective Analysis compares the cost of interventions with their intended impacts. Cost Effective Analysis is widely used to appraise investments in the social sector, however, has rarely been used in the transport sector. This has largely been due to the belief that the impacts of transport interventions are mainly economic in nature and should be measured. With the increased focus on the poverty and social impacts of transport investments, and their justification on these broader grounds, Cost Effective Analysis has recently become more prominent.
Cost-effectiveness ratios (e.g. cost per beneficiary in the case of the Andhra Pradesh example illustrated in Box 2) must always be used with caution. If we have several cost-effectiveness ratios and either the numerator or the denominator are exactly the same number in all cases, cost-effectiveness ratios can be used safely for decision making. Otherwise, one must exercise caution. When using cost-effectiveness ratios, analysts are well advised to ask three questions. First, can I increase the intensity of an intervention and improve the results? Second, can I combine interventions and improve the results? Third, is the marginal gain from an intervention worth the extra cost?. The reader is referred to the World Bank’s Handbook on Investment Operations (World Bank, 1998 [1]) for further reading.
Box 2: Ranking Using Cost Effective Analysis – The Case of Andhra Pradesh
|
One
of the first Bank-financed rural transport projects where Cost Effective Analysis
was intensively used for the ranking of rural road investments was the Rural
Roads Component of the Andhra Pradesh Economic Restructuring Project. The
selection process used in this project is described in figure below. The Cost
Effective Analysis was applied to rank individual links of a “core network”
selected on the basis of screening criteria. The cost effectiveness indicator
was defined as the cost of improving a particular link to “basic access
standard” divided by the number of people served by the link. Cost-effectiveness
indicator of link(i) = Cost of upgrading of link(i)
to basic access standard Population served by link(i) On this basis, up to 700 individual links were
ranked. In view of the available financing,
it was then decided that the maximum amount of investment allowed per link
would be US$50 per person served.
Notes: * selection of 3 poor districts
out of 22 ** focus
on one all-season link to the main road per village *** core
network divided into 700 links **** Roads
where traffic is sufficient to get an ERR above 12% |
|||||||||||||
Source:
Lebo and Schelling (2001) [2] and Liu (2000) [[5]]
Weighted Cost Effectiveness (or Multi-Criteria Analysis)
Sometimes project evaluation requires joint consideration
of multiple outcomes - for example, test scores in two subjects - and perhaps
also their distribution across population groups. In such situations, a first step is to assess the importance of
each outcome with respect to a single goal.
The assessment is usually a subjective judgment derived from one or many
sources, including expert opinion, policymakers’ preferences, community views,
and so on. These subjective judgments
are then translated into weights. Once the weights are estimated, the next step
is to multiply each of the outcomes by the weights to obtain a single composite
measure. The final step is to divide the composite measure by the cost of the
options being considered. The results are called weighted cost effectiveness
ratios.
With respect to low volume rural roads and other rural transport infrastructure (RTI) criteria such as traffic level, population, proximity to health and educational facilities and agricultural assets receive weights (points) relative to their perceived importance. Each road link is then allocated the number of points corresponding to the fulfilment of the particular criteria. The aggregate number of points that each intervention receives is computed by simply adding the points allocated per indicator, or through the application of a more complex formula. The result of this process leads to a ranking of the investment options.
The reliance on subjective data gives rise to important shortcomings in weighted cost-effectiveness analysis. These shortcomings relate to two questions: Who should rank the benefits of the options being considered? How should the rankings of each person or group be combined to obtain an overall ranking?
Choosing the right respondents is critical. An obvious group to consult are people who will be affected by the interventions. But there are other relevant groups, including experts with specific knowledge about the interventions and government officials responsible for implementing the options and managing the public resources involved. Given that the choice of respondents is itself a subjective decision, different evaluators working on the same problem almost invariably arrive at different conclusions using weighted cost-effectiveness analysis. The method is also unlikely to produce consistent comparisons from project to project.
The consolidation of individual rankings is also tricky. One problem is that preference scales indicate ordinal rather than cardinal interpretations. An outcome assigned a score of, say, 8 is superior to one assigned a score of 4, but it does not necessarily mean that the first outcome is twice as preferable. Another problem is that the same score may not mean the same thing to different individuals. Finally, there is the problem of combining the individual scores. Simple summation may be appealing, but the procedure would not be appropriate if there are interactions among the individuals so that their scores should really be combined in some other way. Because of the problems associated with interpreting subjective weights in project evaluation, weighted cost-effectiveness analysis should be used with extreme caution, and the weights be made explicit.
In most examples, indicators used under Multi-Criteria Analysis (MCA) implicitly reflect economic and subjective evaluations. If the weights and points are decided upon and allocated in a participatory way, MCA has the potential to be a participatory planning method based on implicit socio-economic valuation. However, it tends to be applied by consultants or planners in isolation without consultation with the concerned users and stakeholders. The outcome of the MCA methodology, is often, unfortunately, non-transparent, especially if too many factors are considered and a complicated formula applied. Therefore, if adopted, this method has to be used with great care and kept simple, transparent, and participatory. Such an example is illustrated in Box 3 for the case of a rural transport project in Vietnam, where poverty, population, facilities and unused land are considered.
Box 3: Applying the Basic Access Approach: Vietnam’s Second Rural Transport Project
|
The overall goal of this project is to
contribute to poverty reduction in rural Vietnam. To meet this objective, the
project aims to provide “basic road access” to all communes in participating
provinces. For purposes of the project, basic road access is defined as
year-round motorized access from the commune centre to the closest district
centre. District centres have many of the higher level facilities –
hospitals, upper secondary schools, market centres. Effective year-round road
access to the district centre can be expected to make significant impacts on
living standards in the communes. A) Basic Access Roads: Before project
implementation, it was not clear whether the budget would be sufficient to
provide basic access roads to all communes; (there was also the possibility
that it would be too much). A cost-effectiveness methodology that takes
poverty, population and project costs into account was thus used to
prioritise between eligible roads. Among the different groups in the population,
the formula put about three times more weight on the poor than on the
non-poor. The choice of three as the relative weight on the poor was
discussed and agreed to in focus-group meetings with local non-transport
experts and with the Ministry of Transport. The index for ranking alternative
basic access roads is then: CE1 = (# of poor + 0.3* # of
non-poor)/total cost of rehabilitation B) Selected rehabilitation and spot
improvement on other roads: Once basic road access needs are met, remaining
funding can be devoted to selected rehabilitation and upgrading of other
roads. This budget is allocated to the highest priority road projects as
determined by cost-effectiveness rankings based on a formula that takes into
account poverty, population served, potential for agricultural development
(as measured by unused land with agricultural potential and number of social
and other facilities) and costs of the proposed works. The index for ranking
roads for rehabilitation/spot improvement is: CE2 = {[1 + (unused land/per
person) + (facilities /per person)]*[# of poor + 0.3* # of nonpoor]}/ total
cost of rehabilitation Again, the choice of
variables (subject to data availability) were discussed and agreed to in
focus group meetings with local non-transport experts and with the ministry
of transport. |
Source:
Van de Walle 1999 [[6]].
3 Cost-Effectiveness And Economic Viability
Unlike cost benefit analysis, where projects normally are deemed “uneconomic” when their Economic Rate of Return (ERR) falls below 12%, there are no well established criteria for determining “opportunity cost” thresholds when ranking on the basis of cost-effectiveness. Such a determination is then left to policy makers.
For example, if access can be provided to two, otherwise similar communities at US$100 per person served and US$50 per person served, respectively, cost-effectiveness criteria would clearly “rank” the latter community higher. However, the question that remains is whether US$50 per capita is a sufficient “return” to justify intervention (could that US$50 per person be spent with more impact in another sector, or would it yield an ERR of 12% considering the opportunity cost of capital in the country?).
To overcome the problem of open-ended thresholds associated with the cost effectiveness approach, it is therefore desirable to complement the cost effectiveness approach with either:
· A sample study based on cost-benefit analysis for one or two potential projects within the study area (see Box 4); or
· The development of thresholds of economic viability for varying traffic levels and investment costs (see Box 5). A method and worked example of this approach is illustrated in DFID (2002) [[7]].
Box 4: Bhutan rural access project – Calculation of A threshold for cost effectiveness Analysis
|
An IDA Credit for a “‘Rural Access Project’ in the Kingdom of Bhutan
was approved by the IDA Board in December 1999. The main project objective is to improve access of rural
communities to markets, schools, health centres and other economic and social
infrastructure, in order to improve the quality of life and productivity of
rural communities. The project will,
among other things, help construct about 120 kilometres of rural access roads
in four districts (dzongkhag) in Bhutan, where people have to walk an average
of two days to reach the nearest road.
Bhutan has good agricultural potential, but its villages are on the
slopes of the Himalayan range, and a lack of access roads is a major
socio-economic problem. The Royal
Government of Bhutan (RGOB) attaches great importance to improving rural
access, as it will provide rural communities better access to markets,
schools and health centres, and also help prevent rural-to-urban migration. Since gathering socio-economic data for each project rural road for
purposes of estimating its economic rate of return (ERR) is difficult and
expensive, and since these are low-volume roads (less than 30 vehicles per
day), a detailed cost-benefit analysis of one typical project road was
undertaken. From this a cost
effectiveness measure (per capita investment) was calculated that reflected a
threshold for economic viability of any other project road. The Dakpai-Buli road was considered typical of other project roads.
The detailed cost benefit analysis showed that the road produced an ERR of
above 15 percent for 37 kilometres, costing about $3.6 million and serving
about 8000 direct beneficiaries. This
amounts to a per capita cost of about $450 in terms of project cost per
beneficiary. Based on this, the per
capita investment corresponding to 12 percent ERR is about $560. In other
words, based on the Dakpai-Buli road impact analysis, a per capita investment
per beneficiary of $560 (in 1999 prices) is considered viable at 12 percent
ERR. In view of the difficulty of repeating such detailed studies for all
the project roads, and since the access problems and economic conditions are
similar in the service areas of other project roads, the norm of a maximum per
capita (per beneficiary) cost of $560 is applied as an acceptable threshold
for economic viability. These
criteria had to be satisfied for all project roads. The preliminary analysis for the other project roads shows that
the per-capita investment for the remaining project roads will be less than
$450, indicating a higher than 15 percent ERR, based on the Dakpai-Buli road
norm. This indicates that the overall
Project ERR would exceed the 15 percent estimated for the Dakpai-Buli Road. |
Adapted
from Lebo and Schelling (2001) Appendix E.2 [2]
Box 5: Development of thresholds of economic viability
|
Usually estimates of existing and future traffic are used as an input
to the analysis. The problem with this is that estimates of traffic for
low-volume rural access routes are expensive to collect and subject to high
degrees of error. Based on a known
mix of traffic and assuming that this does not vary over time, the cost saving
per item of traffic can be determined. This can be calculated by using
assumptions as to the original and final roughness of the road and hence, the
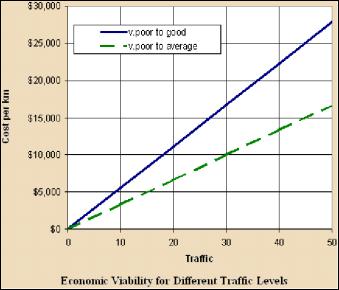
savings in vehicle operating costs. A graph can then easily be drawn of cost
against volume of traffic. This is illustrated by the graph below. Economic
viability of projects associated with upgrading road quality by traffic level
(vehicles per day)
The usefulness of this approach in the context of rural access
improvements is that it gives a quick guide to the level of investment up to
which a net benefit will result. In addition it gives an indication of the
sensitivity of the result. The graph shows, for instance, that, if existing average traffic
levels are 20 vehicles per day, the maximum economically viable investment is
about $11,000 per kilometre if the road is to be improved from very poor
condition to good condition. To achieve this level of improvement may require
substantial rehabilitation of the road. The question then is, can this be
accomplished within an economic cost of $11,000? If not, a possible
alternative may be to improve the route from very poor condition to average
condition. This may be possible with much cheaper spot improvement. Now,
using the lower line it can be seen that for 20 vehicles per day the maximum
economically viable investment is about $7,000. The approach clearly needs to be handled with care. One of its main
strengths is that it puts numerical results into a visual form. It is
interesting to note that, though derived for the DFID Guide using data from
Bangladesh, the resulting graph appears to be broadly consistent with some
results obtained in East Africa. |
Source:
DFID (2002) [7]
4 Summary
When there are quantitative data on the relation between project interventions and their outcomes, and when only a single dimension of outcomes matters, cost-effectiveness analysis offers a systematic tool for comparison. The method does not incorporate subjective judgements. When such judgements enter into measuring project outcomes, the method is called weighted cost-effectiveness analysis or Multi-Criteria Analysis (MCA). The main advantage of weighted cost-effectiveness analysis is that it can be used to compare a wider range of project outcomes. However, MCA often leads to non-transparent results, and is recommended only if cost criteria are included, and if the criteria are few, relevant, and have been determined (including their relative weights) in a participatory way.
Cost effectiveness techniques are useful for:
· Project screening and ranking; and
· Project evaluation where a substantial component of the benefits are difficult to or cannot be monetised, where options are similar in nature (as when prioritising the re-habilitation of a number of roads) and/or there is a high cost of data collection, relative to the cost of the proposed intervention.
Typical projects would include low volume rural roads and other rural transport infrastructure.
Should cost effectiveness measures be used the contribution of the intervention to meeting the overriding objectives of the investment strategy should be clearly identified. For example, if the objective is poverty alleviation then an appropriate measure could be cost per poor person who would experience benefit.
If cost effectiveness criteria are to be used as the basis for the justification of the investment the project should concern the provision of least cost basic access. Thresholds of economic viability should also be demonstrated.